
Landlord's Agent in 2025
Suzanne Kunda
Freestyle Real Estate LLC
(484) 686-7872
2 in this area
186 Total Sales
Estimated Value: $225,092 - $278,000
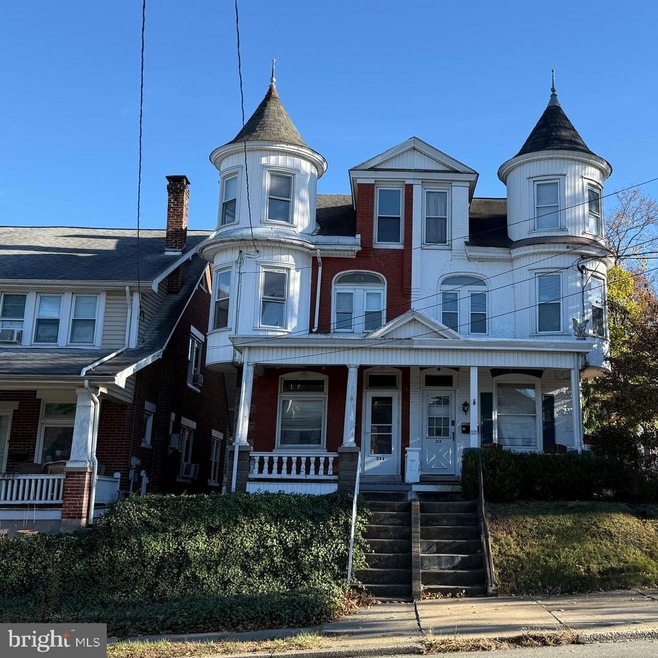
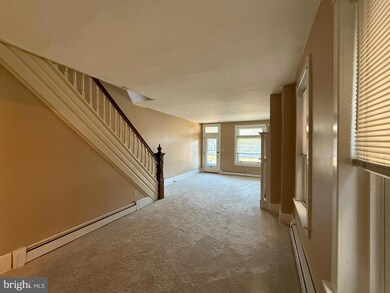
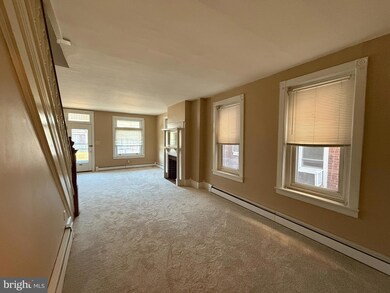
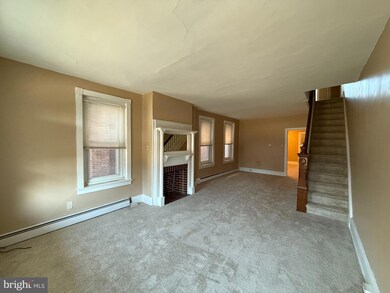
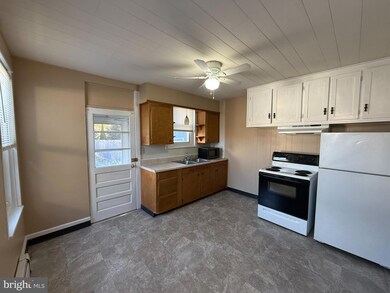
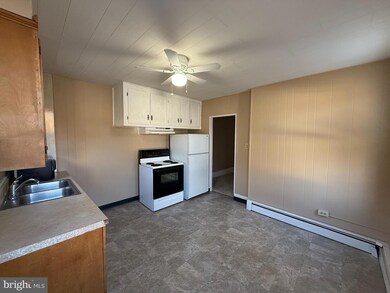
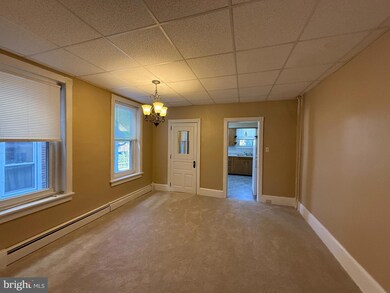
A great find in the Borough! All new flooring and paint throughout. Covered front porch. Family room with large windows and decorative fireplace feature. Dining room area and eat-in kitchen. 3 bedrooms on second floor with full bath. 3rd floor offers additional living space or a potential 4th bedroom. Full basement for great storage with laundry hook-up. Rear yard area on quiet alleyway. Off-street parking!! Tenant responsible for utilities and tenant insurance.
Last Agent to Rent the Property
(484) 686-7872 suzannekunda@aol.com Freestyle Real Estate LLC License #RM421160 Listed on: 11/19/2024
| Date | Buyer | Sale Price | Title Company |
|---|---|---|---|
| Weller Clarence C | -- | None Available | |
| Weller Clarence C | -- | None Available |
| Date | Event | Price | List to Sale | Price per Sq Ft |
|---|---|---|---|---|
| 02/01/2025 02/01/25 | Rented | $1,650 | 0.0% | -- |
| 01/16/2025 01/16/25 | Under Contract | -- | -- | -- |
| 01/06/2025 01/06/25 | Price Changed | $1,650 | -5.7% | $1 / Sq Ft |
| 12/03/2024 12/03/24 | Price Changed | $1,750 | -5.4% | $1 / Sq Ft |
| 11/19/2024 11/19/24 | For Rent | $1,850 | +54.2% | -- |
| 01/18/2020 01/18/20 | Rented | $1,200 | 0.0% | -- |
| 01/12/2020 01/12/20 | Under Contract | -- | -- | -- |
| 12/01/2019 12/01/19 | For Rent | $1,200 | 0.0% | -- |
| 11/16/2018 11/16/18 | Rented | $1,200 | +9.1% | -- |
| 11/10/2018 11/10/18 | Under Contract | -- | -- | -- |
| 08/28/2018 08/28/18 | For Rent | $1,100 | +10.0% | -- |
| 10/03/2017 10/03/17 | Rented | $1,000 | 0.0% | -- |
| 09/29/2017 09/29/17 | Under Contract | -- | -- | -- |
| 06/20/2017 06/20/17 | For Rent | $1,000 | 0.0% | -- |
| 10/24/2015 10/24/15 | Rented | $1,000 | 0.0% | -- |
| 10/12/2015 10/12/15 | Under Contract | -- | -- | -- |
| 09/01/2015 09/01/15 | For Rent | $1,000 | +5.3% | -- |
| 12/01/2013 12/01/13 | Rented | $950 | -5.0% | -- |
| 11/24/2013 11/24/13 | Under Contract | -- | -- | -- |
| 09/06/2013 09/06/13 | For Rent | $1,000 | -- | -- |
| Year | Tax Paid | Tax Assessment Tax Assessment Total Assessment is a certain percentage of the fair market value that is determined by local assessors to be the total taxable value of land and additions on the property. | Land | Improvement |
|---|---|---|---|---|
| 2025 | $1,369 | $70,900 | $33,300 | $37,600 |
| 2024 | $3,417 | $70,900 | $33,300 | $37,600 |
| 2023 | $3,277 | $70,900 | $33,300 | $37,600 |
| 2022 | $3,183 | $70,900 | $33,300 | $37,600 |
| 2021 | $3,073 | $70,900 | $33,300 | $37,600 |
| 2020 | $3,001 | $70,900 | $33,300 | $37,600 |
| 2019 | $2,887 | $70,900 | $33,300 | $37,600 |
| 2018 | $2,766 | $70,900 | $33,300 | $37,600 |
| 2017 | $2,679 | $70,900 | $33,300 | $37,600 |
| 2016 | $904 | $70,900 | $33,300 | $37,600 |
| 2015 | $904 | $70,900 | $33,300 | $37,600 |
| 2014 | $869 | $70,900 | $33,300 | $37,600 |
Landlord's Agent in 2025
Suzanne Kunda
Freestyle Real Estate LLC
(484) 686-7872
2 in this area
186 Total Sales
Tenant's Agent in 2025
Susan Cusumano
Freestyle Real Estate LLC
(610) 256-1725
41 Total Sales
Buyer's Agent in 2020
Ashley Taylor
Keller Williams Realty Group
(484) 331-4637
8 Total Sales
M
Buyer's Agent in 2013
MICHELLE SAKAL
Freestyle Real Estate LLC
Source: Bright MLS
MLS Number: PABK2051272
APN: 33-5387-20-92-7429
Disclaimer: Certain information contained herein is derived from information provided by parties other than Homes.com. All information provided is deemed reliable, but is not guaranteed to be accurate and should be independently verified.
![]() The data relating to real estate for sale on this website appears in part through the BRIGHT Internet Data Exchange program, a voluntary cooperative exchange of property listing data between licensed real estate brokerage firms, and is provided by BRIGHT through a licensing agreement.
The data relating to real estate for sale on this website appears in part through the BRIGHT Internet Data Exchange program, a voluntary cooperative exchange of property listing data between licensed real estate brokerage firms, and is provided by BRIGHT through a licensing agreement.
Listing information is from various brokers who participate in the Bright MLS IDX program and not all listings may be visible on the site.
The property information being provided on or through the website is for the personal, non-commercial use of consumers and such information may not be used for any purpose other than to identify prospective properties consumers may be interested in purchasing.
Some properties which appear for sale on the website may no longer be available because they are for instance, under contract, sold or are no longer being offered for sale.
Property information displayed is deemed reliable but is not guaranteed.
Copyright 2025 Bright MLS, Inc.