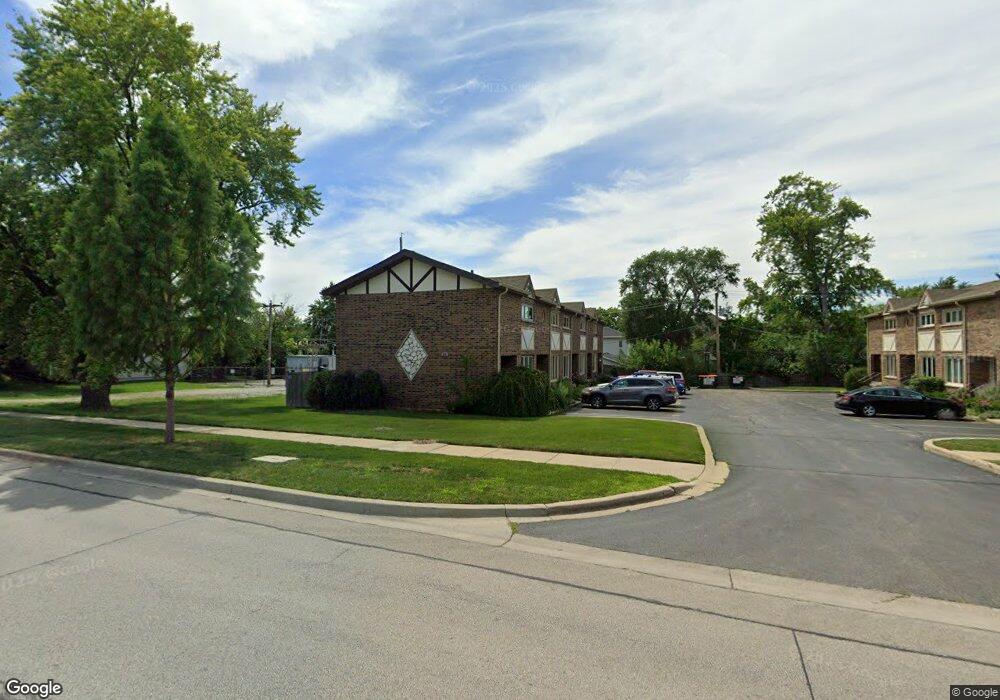
214 N West Ave Unit 2 Elmhurst, IL 60126
Estimated Value: $304,000 - $408,000
--
Bed
--
Bath
1,102
Sq Ft
$315/Sq Ft
Est. Value
About This Home
This home is located at 214 N West Ave Unit 2, Elmhurst, IL 60126 and is currently estimated at $346,848, approximately $314 per square foot. 214 N West Ave Unit 2 is a home located in DuPage County with nearby schools including Reinberg Elementary School, Ruggles Elementary School, and Hawthorne Elementary School.
Ownership History
Date
Name
Owned For
Owner Type
Purchase Details
Closed on
Aug 10, 2001
Sold by
Young Jason A and Bellecomo Young Nicole
Bought by
Reonal Yvonne V
Current Estimated Value
Home Financials for this Owner
Home Financials are based on the most recent Mortgage that was taken out on this home.
Original Mortgage
$136,800
Interest Rate
6.97%
Mortgage Type
Purchase Money Mortgage
Purchase Details
Closed on
Jan 5, 1999
Sold by
Berte Dave L
Bought by
Young Jason A and Bellecomo Nicole L
Home Financials for this Owner
Home Financials are based on the most recent Mortgage that was taken out on this home.
Original Mortgage
$112,500
Interest Rate
6.83%
Mortgage Type
Purchase Money Mortgage
Purchase Details
Closed on
Aug 30, 1995
Sold by
Blake Donna L
Bought by
Berte Dave L
Home Financials for this Owner
Home Financials are based on the most recent Mortgage that was taken out on this home.
Original Mortgage
$107,800
Interest Rate
7.76%
Mortgage Type
Purchase Money Mortgage
Create a Home Valuation Report for This Property
The Home Valuation Report is an in-depth analysis detailing your home's value as well as a comparison with similar homes in the area
Home Values in the Area
Average Home Value in this Area
Purchase History
| Date | Buyer | Sale Price | Title Company |
|---|---|---|---|
| Reonal Yvonne V | $152,000 | -- | |
| Young Jason A | $125,500 | -- | |
| Berte Dave L | $113,500 | Attorneys Title Guaranty Fun |
Source: Public Records
Mortgage History
| Date | Status | Borrower | Loan Amount |
|---|---|---|---|
| Previous Owner | Reonal Yvonne V | $136,800 | |
| Previous Owner | Young Jason A | $112,500 | |
| Previous Owner | Berte Dave L | $107,800 |
Source: Public Records
Tax History Compared to Growth
Tax History
| Year | Tax Paid | Tax Assessment Tax Assessment Total Assessment is a certain percentage of the fair market value that is determined by local assessors to be the total taxable value of land and additions on the property. | Land | Improvement |
|---|---|---|---|---|
| 2024 | $4,621 | $84,673 | $8,467 | $76,206 |
| 2023 | $4,268 | $78,300 | $7,830 | $70,470 |
| 2022 | $3,637 | $65,980 | $6,590 | $59,390 |
| 2021 | $3,541 | $64,340 | $6,430 | $57,910 |
| 2020 | $3,399 | $62,930 | $6,290 | $56,640 |
| 2019 | $3,632 | $64,960 | $6,490 | $58,470 |
| 2018 | $3,091 | $55,900 | $5,580 | $50,320 |
| 2017 | $3,012 | $53,270 | $5,320 | $47,950 |
| 2016 | $2,933 | $50,180 | $5,010 | $45,170 |
| 2015 | $2,884 | $46,750 | $4,670 | $42,080 |
| 2014 | $3,015 | $45,120 | $4,510 | $40,610 |
| 2013 | $2,986 | $45,750 | $4,570 | $41,180 |
Source: Public Records
Map
Nearby Homes
- 285 N Ridgeland Ave
- 407 W North Ave
- 284 N Highland Ave
- 322 N Highland Ave
- 355 W 1st St
- 196 N Walnut St
- 156 S Sunnyside Ave
- 120 N Walnut St
- 170 S Fairview Ave
- 412 N Ridgeland Ave
- 17W517 Manor Ln
- 104 Evergreen Ave
- 442 N Oak St
- 508 W Alma St
- 204 E Hill St
- 255 S West Ave Unit 214
- 255 S West Ave Unit 413
- 468 N Highland Ave
- 193 N Elm Ave
- 452 W Alma St
- 214 N West Ave Unit A
- 214 N West Ave Unit D
- 214 N West Ave Unit C
- 214 N West Ave Unit 5
- 214 N West Ave Unit 1
- 214 N West Ave Unit 3
- 216 N West Ave Unit 3
- 216 N West Ave Unit 2
- 216 N West Ave Unit 4
- 216 N West Ave Unit 5
- 216 N West Ave Unit A
- 216 N West Ave Unit 1
- 201 N Glenview Ave
- 203 N Glenview Ave
- 209 N Glenview Ave
- 208 N West Ave
- 197 N Glenview Ave
- 217 N Glenview Ave
- 207 N West Ave
- 193 N Glenview Ave