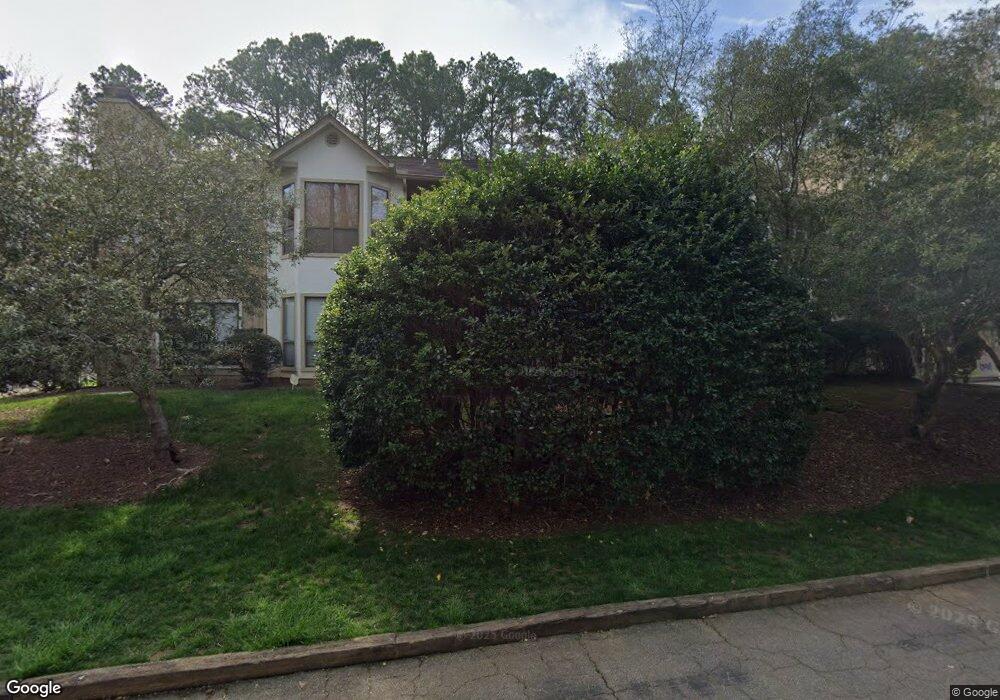
214 New Kent Place Unit 214 Cary, NC 27511
South Cary NeighborhoodEstimated Value: $273,000 - $298,000
2
Beds
2
Baths
1,126
Sq Ft
$253/Sq Ft
Est. Value
About This Home
This home is located at 214 New Kent Place Unit 214, Cary, NC 27511 and is currently estimated at $284,820, approximately $252 per square foot. 214 New Kent Place Unit 214 is a home located in Wake County with nearby schools including Farmington Woods Elementary, East Cary Middle School, and Cary High School.
Ownership History
Date
Name
Owned For
Owner Type
Purchase Details
Closed on
May 9, 2019
Sold by
Mcdonald John Dee
Bought by
Mcdonald Karen Denise
Current Estimated Value
Purchase Details
Closed on
May 6, 2013
Sold by
Wagner Jeanne M
Bought by
Mcdonald John Dee
Purchase Details
Closed on
Apr 22, 2011
Sold by
Brock Annette F and Harris William C
Bought by
Wagner Jeanne M
Home Financials for this Owner
Home Financials are based on the most recent Mortgage that was taken out on this home.
Original Mortgage
$78,400
Interest Rate
4.74%
Mortgage Type
New Conventional
Purchase Details
Closed on
May 22, 2008
Sold by
Melzer Ronald
Bought by
Brock Annette F and Harris William C
Home Financials for this Owner
Home Financials are based on the most recent Mortgage that was taken out on this home.
Original Mortgage
$92,500
Interest Rate
5.84%
Mortgage Type
Unknown
Create a Home Valuation Report for This Property
The Home Valuation Report is an in-depth analysis detailing your home's value as well as a comparison with similar homes in the area
Home Values in the Area
Average Home Value in this Area
Purchase History
| Date | Buyer | Sale Price | Title Company |
|---|---|---|---|
| Mcdonald Karen Denise | -- | None Available | |
| Mcdonald Karen Denise | -- | None Listed On Document | |
| Mcdonald John Dee | $102,000 | None Available | |
| Wagner Jeanne M | $98,000 | None Available | |
| Brock Annette F | $92,500 | None Available |
Source: Public Records
Mortgage History
| Date | Status | Borrower | Loan Amount |
|---|---|---|---|
| Previous Owner | Wagner Jeanne M | $78,400 | |
| Previous Owner | Brock Annette F | $92,500 |
Source: Public Records
Tax History Compared to Growth
Tax History
| Year | Tax Paid | Tax Assessment Tax Assessment Total Assessment is a certain percentage of the fair market value that is determined by local assessors to be the total taxable value of land and additions on the property. | Land | Improvement |
|---|---|---|---|---|
| 2025 | $2,347 | $271,545 | -- | $271,545 |
| 2024 | $2,297 | $271,545 | $0 | $271,545 |
| 2023 | $1,697 | $167,369 | $0 | $167,369 |
| 2022 | $1,634 | $167,369 | $0 | $167,369 |
| 2021 | $1,602 | $167,369 | $0 | $167,369 |
| 2020 | $1,610 | $167,369 | $0 | $167,369 |
| 2019 | $1,241 | $114,017 | $0 | $114,017 |
| 2018 | $1,165 | $114,017 | $0 | $114,017 |
| 2017 | $1,120 | $114,017 | $0 | $114,017 |
| 2016 | $1,104 | $114,017 | $0 | $114,017 |
| 2015 | -- | $110,394 | $0 | $110,394 |
| 2014 | $1,044 | $110,394 | $0 | $110,394 |
Source: Public Records
Map
Nearby Homes
- 512 New Kent Place Unit 512
- 104 Eagle Ct
- 124 Twin Oaks Place
- 210 Twin Oaks Place
- 119 Hanover Place
- 114 Drummond Place
- 1305 Hampton Valley Rd
- 135 Drummond Place Unit 7C
- 1017 Thistle Briar Place
- 122 Clancy Cir
- 408 Brookcliff Ln
- 1404 Rock Creek Ln
- 915 Ball Field Alley Unit 305
- 915 Ball Field Alley Unit 102
- 915 Ball Field Alley Unit 104
- 915 Ball Field Alley Unit 101
- 102 Climbing Ivy Ct
- 102 Shriver Ct
- 103 Shriver Ct
- 106 Greenwood Cir
- 224 New Kent Place
- 223 New Kent Place
- 222 New Kent Place Unit 222
- 221 New Kent Place
- 213 New Kent Place Unit 213
- 212 New Kent Place Unit 212
- 211 New Kent Place Unit 211
- 221 New Kent Place Unit 221
- 211 New Kent Place Unit 221
- 212 New Kent Place Unit 1
- 221 New Kent Place Unit 1024
- 224 New Kent Place Unit 224
- 424 New Kent Place Unit 424
- 423 New Kent Place Unit 423
- 422 New Kent Place
- 421 New Kent Place Unit 421
- 414 New Kent Place
- 413 New Kent Place Unit 413
- 412 New Kent Place
- 411 New Kent Place