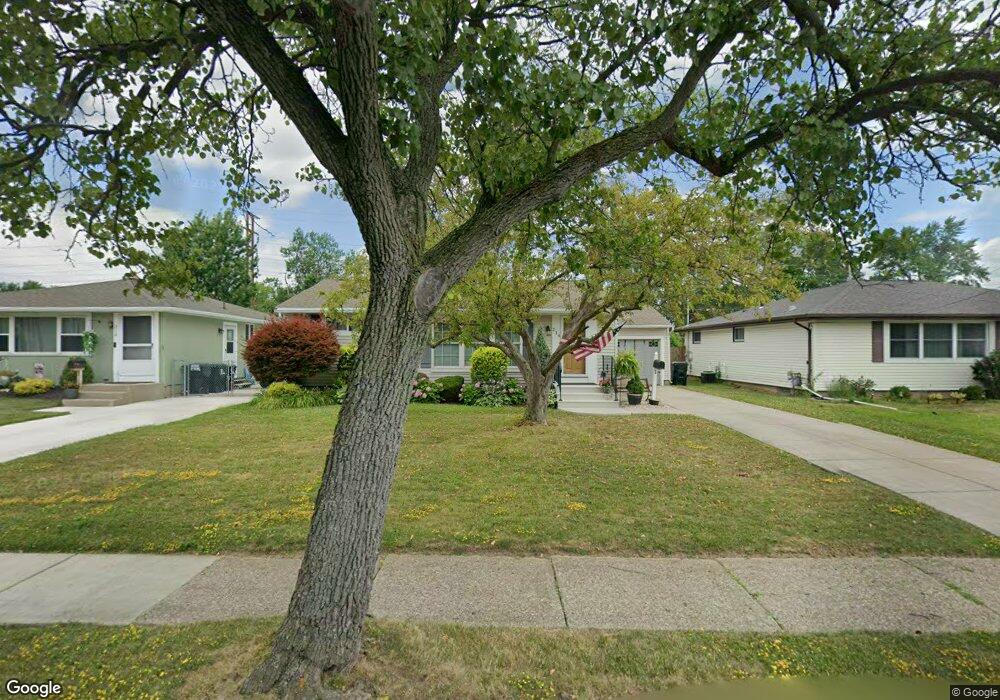
214 Newell Ave Tonawanda, NY 14150
Estimated Value: $224,000 - $246,588
3
Beds
1
Bath
1,000
Sq Ft
$237/Sq Ft
Est. Value
About This Home
This home is located at 214 Newell Ave, Tonawanda, NY 14150 and is currently estimated at $237,397, approximately $237 per square foot. 214 Newell Ave is a home located in Erie County with nearby schools including Thomas A. Edison Elementary School, Ben Franklin Middle School, and Kenmore East Senior High School.
Ownership History
Date
Name
Owned For
Owner Type
Purchase Details
Closed on
Apr 25, 2013
Sold by
Hooper Patricia Buscaglia and Buscaglia Patricia
Bought by
Buscaglia Patricia
Current Estimated Value
Purchase Details
Closed on
Jan 12, 2009
Sold by
Wawrzyniec Bryan
Bought by
Buscaglia Patricia
Home Financials for this Owner
Home Financials are based on the most recent Mortgage that was taken out on this home.
Original Mortgage
$72,900
Outstanding Balance
$46,909
Interest Rate
5.52%
Mortgage Type
New Conventional
Estimated Equity
$190,488
Purchase Details
Closed on
Apr 18, 2007
Sold by
Shear Thomas and Lucieer Mary Ellen
Bought by
Wawrzyniec Bryan
Home Financials for this Owner
Home Financials are based on the most recent Mortgage that was taken out on this home.
Original Mortgage
$71,200
Interest Rate
6.19%
Mortgage Type
Purchase Money Mortgage
Purchase Details
Closed on
Jul 19, 2006
Sold by
Shear Josephine E
Bought by
Shear Thomas and Lucieer Mary Ellen
Create a Home Valuation Report for This Property
The Home Valuation Report is an in-depth analysis detailing your home's value as well as a comparison with similar homes in the area
Home Values in the Area
Average Home Value in this Area
Purchase History
| Date | Buyer | Sale Price | Title Company |
|---|---|---|---|
| Buscaglia Patricia | $90,000 | None Available | |
| Buscaglia Patricia | $81,000 | None Available | |
| Wawrzyniec Bryan | $71,200 | None Available | |
| Shear Thomas | -- | None Available |
Source: Public Records
Mortgage History
| Date | Status | Borrower | Loan Amount |
|---|---|---|---|
| Open | Buscaglia Patricia | $72,900 | |
| Previous Owner | Wawrzyniec Bryan | $71,200 |
Source: Public Records
Tax History Compared to Growth
Tax History
| Year | Tax Paid | Tax Assessment Tax Assessment Total Assessment is a certain percentage of the fair market value that is determined by local assessors to be the total taxable value of land and additions on the property. | Land | Improvement |
|---|---|---|---|---|
| 2024 | $4,633 | $47,300 | $10,900 | $36,400 |
| 2023 | $5,632 | $47,300 | $10,900 | $36,400 |
| 2022 | $5,309 | $47,300 | $10,900 | $36,400 |
| 2021 | $5,290 | $47,300 | $10,900 | $36,400 |
| 2020 | $3,889 | $47,300 | $10,900 | $36,400 |
| 2019 | $3,761 | $47,300 | $10,900 | $36,400 |
| 2018 | $3,712 | $47,300 | $10,900 | $36,400 |
| 2017 | $1,711 | $47,300 | $10,900 | $36,400 |
| 2016 | $3,501 | $47,300 | $10,900 | $36,400 |
| 2015 | -- | $47,300 | $10,900 | $36,400 |
| 2014 | -- | $47,300 | $10,900 | $36,400 |
Source: Public Records
Map
Nearby Homes