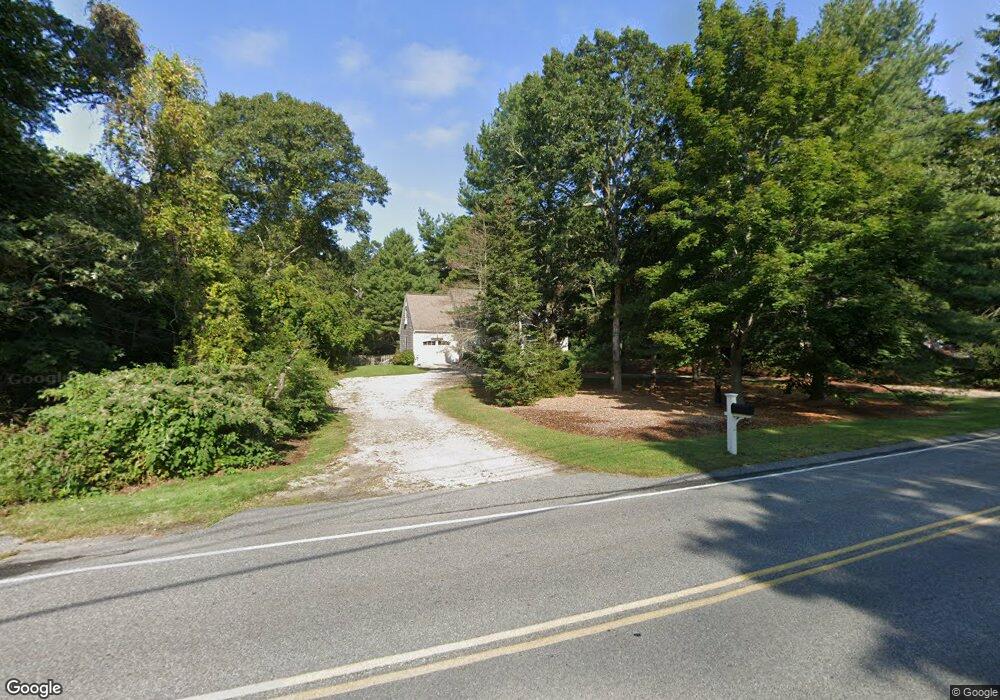
214 Putnam Ave Cotuit, MA 02635
Cotuit NeighborhoodEstimated Value: $762,000 - $905,000
3
Beds
2
Baths
1,590
Sq Ft
$506/Sq Ft
Est. Value
About This Home
This home is located at 214 Putnam Ave, Cotuit, MA 02635 and is currently estimated at $804,327, approximately $505 per square foot. 214 Putnam Ave is a home located in Barnstable County with nearby schools including West Villages Elementary School, Barnstable United Elementary School, and Barnstable Intermediate School.
Ownership History
Date
Name
Owned For
Owner Type
Purchase Details
Closed on
Apr 18, 2023
Sold by
Garvey Judith M
Bought by
Bruster Katelyn
Current Estimated Value
Purchase Details
Closed on
May 1, 1998
Sold by
Poirier Mark E and Poirier Melissa A
Bought by
Garvey Judith M
Create a Home Valuation Report for This Property
The Home Valuation Report is an in-depth analysis detailing your home's value as well as a comparison with similar homes in the area
Home Values in the Area
Average Home Value in this Area
Purchase History
| Date | Buyer | Sale Price | Title Company |
|---|---|---|---|
| Bruster Katelyn | -- | None Available | |
| Garvey Judith M | $185,000 | -- |
Source: Public Records
Mortgage History
| Date | Status | Borrower | Loan Amount |
|---|---|---|---|
| Previous Owner | Garvey Judith M | $68,700 | |
| Previous Owner | Garvey Judith M | $230,000 | |
| Previous Owner | Garvey Judith M | $180,000 |
Source: Public Records
Tax History
| Year | Tax Paid | Tax Assessment Tax Assessment Total Assessment is a certain percentage of the fair market value that is determined by local assessors to be the total taxable value of land and additions on the property. | Land | Improvement |
|---|---|---|---|---|
| 2025 | $5,184 | $620,800 | $206,400 | $414,400 |
| 2024 | $4,721 | $599,100 | $206,400 | $392,700 |
| 2023 | $4,637 | $554,000 | $204,300 | $349,700 |
| 2022 | $4,603 | $445,200 | $146,300 | $298,900 |
| 2021 | $4,483 | $406,000 | $146,300 | $259,700 |
| 2020 | $4,788 | $408,900 | $156,600 | $252,300 |
| 2019 | $4,545 | $382,600 | $156,600 | $226,000 |
| 2018 | $4,403 | $370,600 | $171,800 | $198,800 |
| 2017 | $4,270 | $361,900 | $171,800 | $190,100 |
| 2016 | $4,169 | $362,200 | $172,100 | $190,100 |
| 2015 | $4,037 | $350,400 | $165,000 | $185,400 |
Source: Public Records
Map
Nearby Homes
- 135 Putnam Avenue (Land)
- 804 Main St
- 602 Putnam Ave
- 916 Main St
- 33 Oyster Place Rd
- 564 Cotuit Bay Dr
- 564 Cotuit Bay Dr
- 239 Oxford Dr
- 835 Old Post Rd
- 1081 Main St
- 30 Wings Ln
- 71 Sand Point
- 440 Grand Island Dr
- 165 Baxter Neck Rd
- 25 Oyster Way
- 188 Ocean View Ave
- 226 Dunrobin Rd
- 15 Geraldine Rd
- Lot 288 Seapuit River Rd A
- 75 Bob White Run
Your Personal Tour Guide
Ask me questions while you tour the home.