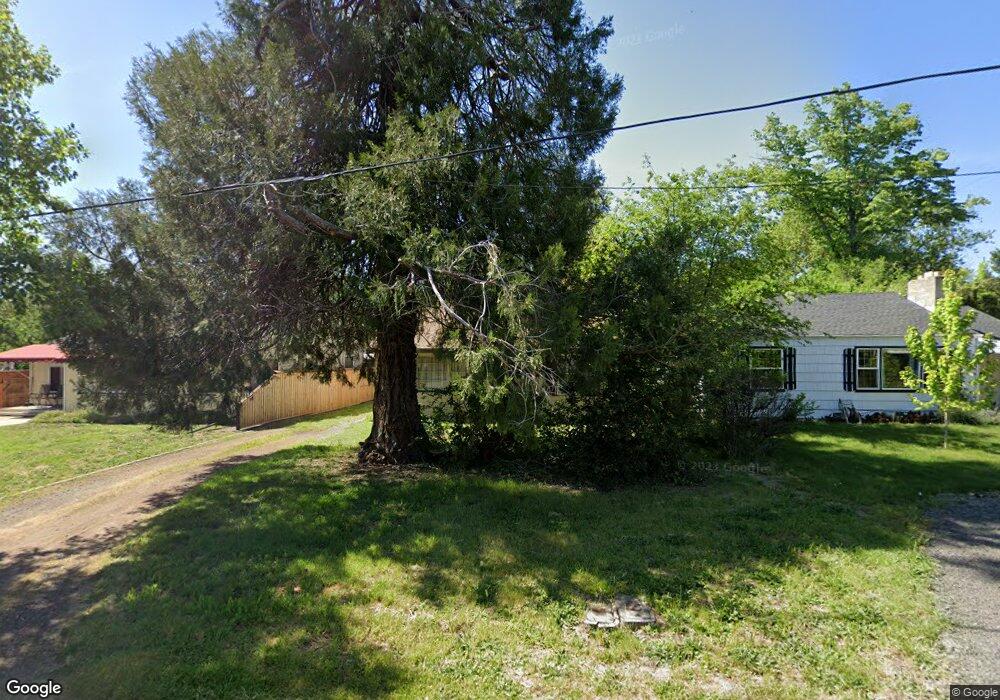
214 S Barneburg Rd Medford, OR 97504
Estimated Value: $302,000 - $337,000
2
Beds
1
Bath
925
Sq Ft
$347/Sq Ft
Est. Value
About This Home
This home is located at 214 S Barneburg Rd, Medford, OR 97504 and is currently estimated at $320,868, approximately $346 per square foot. 214 S Barneburg Rd is a home located in Jackson County with nearby schools including Hoover Elementary School, Hedrick Middle School, and South Medford High School.
Ownership History
Date
Name
Owned For
Owner Type
Purchase Details
Closed on
Jan 13, 2025
Sold by
Ryder Ted A
Bought by
Ted A Ryder Revocable Living Trust and Ryder
Current Estimated Value
Purchase Details
Closed on
Jan 28, 2003
Sold by
Wilcox Kathi and Wilcox Kale
Bought by
Ryder Ted A and Ryder Peggy J
Purchase Details
Closed on
Sep 25, 1998
Sold by
Dunagan James M and Dunagan Shelley J
Bought by
Wilcox Kathi and Wilcox Kale
Home Financials for this Owner
Home Financials are based on the most recent Mortgage that was taken out on this home.
Original Mortgage
$85,000
Interest Rate
6.88%
Purchase Details
Closed on
Nov 10, 1997
Sold by
Bettis Thomas Lee and Kerska Jacqueline K
Bought by
Dunagan James M and Dunagan Shelly J
Home Financials for this Owner
Home Financials are based on the most recent Mortgage that was taken out on this home.
Original Mortgage
$77,900
Interest Rate
7.3%
Create a Home Valuation Report for This Property
The Home Valuation Report is an in-depth analysis detailing your home's value as well as a comparison with similar homes in the area
Home Values in the Area
Average Home Value in this Area
Purchase History
| Date | Buyer | Sale Price | Title Company |
|---|---|---|---|
| Ted A Ryder Revocable Living Trust | -- | None Listed On Document | |
| Ryder Ted A | $115,000 | Lawyers Title Ins Corp | |
| Wilcox Kathi | $87,000 | Jackson County Title | |
| Dunagan James M | $82,000 | Amerititle |
Source: Public Records
Mortgage History
| Date | Status | Borrower | Loan Amount |
|---|---|---|---|
| Previous Owner | Wilcox Kathi | $85,000 | |
| Previous Owner | Dunagan James M | $77,900 |
Source: Public Records
Tax History Compared to Growth
Tax History
| Year | Tax Paid | Tax Assessment Tax Assessment Total Assessment is a certain percentage of the fair market value that is determined by local assessors to be the total taxable value of land and additions on the property. | Land | Improvement |
|---|---|---|---|---|
| 2025 | $2,387 | $164,570 | $86,050 | $78,520 |
| 2024 | $2,387 | $159,780 | $83,540 | $76,240 |
| 2023 | $2,314 | $155,130 | $81,110 | $74,020 |
| 2022 | $2,257 | $155,130 | $81,110 | $74,020 |
| 2021 | $2,199 | $150,620 | $78,760 | $71,860 |
| 2020 | $2,153 | $146,240 | $76,470 | $69,770 |
| 2019 | $2,102 | $137,860 | $72,090 | $65,770 |
| 2018 | $2,048 | $133,850 | $70,000 | $63,850 |
| 2017 | $2,011 | $133,850 | $70,000 | $63,850 |
| 2016 | $2,024 | $126,180 | $65,990 | $60,190 |
| 2015 | $1,946 | $126,180 | $65,990 | $60,190 |
| 2014 | $1,912 | $118,950 | $62,200 | $56,750 |
Source: Public Records
Map
Nearby Homes
- 149 S Keene Way Dr
- 430 Highland Dr
- 12 Glen Oak Ct
- 17 Glen Oak Ct
- 341 Ardmore Ave
- 433 Highland Dr
- 1711 E Main St
- 305 S Groveland Ave
- 317 Eastwood Dr
- 9 S Groveland Ave
- 204 Mount Echo Dr
- 1418 Appleton Cir
- 2233 Oakwood Dr
- 1503 E Main St
- 302 Medford Heights Ln
- 1279 Maple Leaf Ct Unit 1C
- 1279 Maple Leaf Ct Unit 1A
- 200 Oregon Terrace
- 120 Ashland Ave
- 312 N Barneburg Rd
- 212 S Barneburg Rd
- 216 S Barneburg Rd
- 208 S Barneburg Rd
- 151 Highland Dr
- 155 Highland Dr
- 157 Highland Dr
- 147 Highland Dr
- 1848 Woodlawn Dr
- 1846 Woodlawn Dr
- 213 S Barneburg Rd
- 217 S Barneburg Rd
- 205 S Barneburg Rd
- 1844 Woodlawn Dr
- 505 Keene Dr
- 143 Highland Dr
- 505 S Keene Way Dr
- 513 Keene Dr
- 168 Highland Dr
- 156 Highland Dr
- 1836 Woodlawn Dr