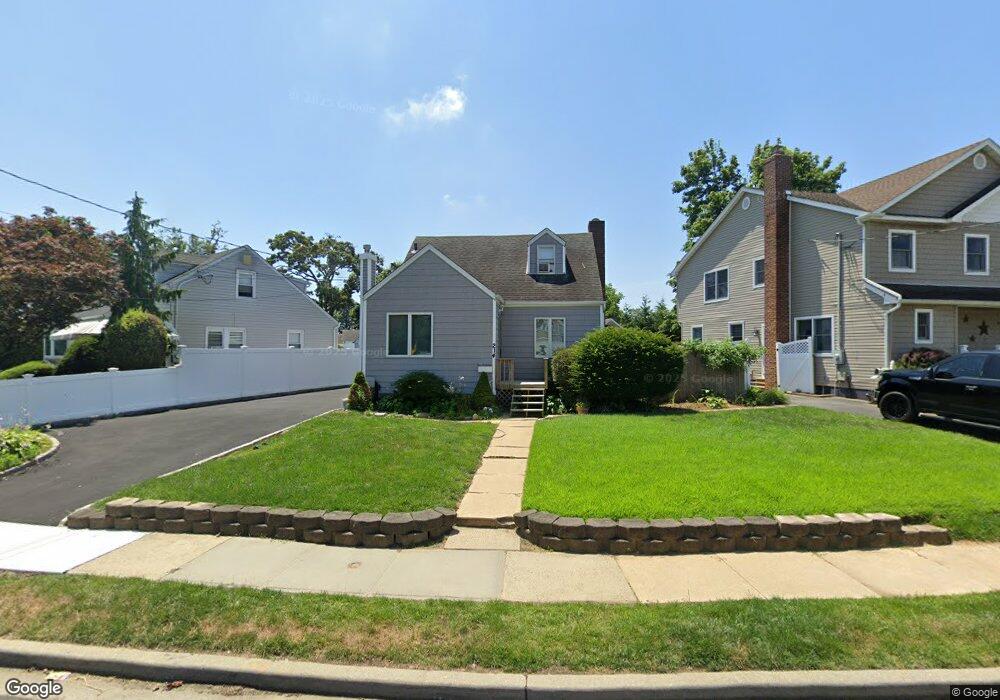
214 Stephen St North Bellmore, NY 11710
Estimated Value: $691,000 - $697,623
--
Bed
1
Bath
1,077
Sq Ft
$645/Sq Ft
Est. Value
About This Home
This home is located at 214 Stephen St, North Bellmore, NY 11710 and is currently estimated at $694,312, approximately $644 per square foot. 214 Stephen St is a home located in Nassau County with nearby schools including Grand Avenue Middle School, Wellington C Mepham High School, and Progressive School of Long Island.
Ownership History
Date
Name
Owned For
Owner Type
Purchase Details
Closed on
Feb 24, 2011
Sold by
Cartlidge Paul
Bought by
Cartlidge Paul James and Paul Cartlidge Trust
Current Estimated Value
Purchase Details
Closed on
Dec 3, 2009
Sold by
Gantovnik Julio
Bought by
Cartlidge Paul and Cartlidge Nancy
Home Financials for this Owner
Home Financials are based on the most recent Mortgage that was taken out on this home.
Original Mortgage
$308,000
Interest Rate
5%
Mortgage Type
Purchase Money Mortgage
Purchase Details
Closed on
Sep 11, 2009
Sold by
Us Bank National Assn
Bought by
Gantovnik Julio
Purchase Details
Closed on
Feb 17, 2009
Sold by
Referee Of Nassau County
Bought by
Downey Savings And Loan Association
Purchase Details
Closed on
Aug 8, 2005
Sold by
Martino Michael
Purchase Details
Closed on
Aug 18, 1998
Sold by
Estate Edmond Andre A
Bought by
Martino Michael J and Martino Sheri V
Create a Home Valuation Report for This Property
The Home Valuation Report is an in-depth analysis detailing your home's value as well as a comparison with similar homes in the area
Home Values in the Area
Average Home Value in this Area
Purchase History
| Date | Buyer | Sale Price | Title Company |
|---|---|---|---|
| Cartlidge Paul James | -- | -- | |
| Cartlidge Paul | $385,840 | -- | |
| Gantovnik Julio | $321,000 | -- | |
| Downey Savings And Loan Association | $420,076 | None Available | |
| -- | -- | -- | |
| Martino Michael J | $135,000 | -- |
Source: Public Records
Mortgage History
| Date | Status | Borrower | Loan Amount |
|---|---|---|---|
| Previous Owner | Cartlidge Paul | $308,000 | |
| Closed | Downey Savings And Loan Association | $0 |
Source: Public Records
Tax History Compared to Growth
Tax History
| Year | Tax Paid | Tax Assessment Tax Assessment Total Assessment is a certain percentage of the fair market value that is determined by local assessors to be the total taxable value of land and additions on the property. | Land | Improvement |
|---|---|---|---|---|
| 2025 | $12,378 | $435 | $212 | $223 |
| 2024 | $3,230 | $435 | $212 | $223 |
| 2023 | $11,993 | $435 | $212 | $223 |
| 2022 | $11,993 | $435 | $212 | $223 |
| 2021 | $16,738 | $417 | $203 | $214 |
| 2020 | $12,545 | $692 | $585 | $107 |
| 2019 | $12,620 | $692 | $585 | $107 |
| 2018 | $11,907 | $692 | $0 | $0 |
| 2017 | $7,519 | $692 | $585 | $107 |
| 2016 | $10,606 | $692 | $585 | $107 |
| 2015 | $2,861 | $692 | $585 | $107 |
| 2014 | $2,861 | $692 | $585 | $107 |
| 2013 | $2,684 | $692 | $585 | $107 |
Source: Public Records
Map
Nearby Homes
- 2468 Lincoln Blvd
- 22 Davenport Place
- 1585 Dewey Ave
- 2239 Henry St
- 2522 Lincoln Blvd
- 15 Jefferson Ave
- 13 Metropolitan Ave
- 1776 Roberta Ln
- 1618 Paula Ct
- 10 Airway Dr
- 106 Soifer Ave
- 2434 Martin Ave
- 2453 Hull Ave
- 2282 Sycamore Place
- 1804 Leona Ct
- 1448 Dewey Ave
- 1600 Irving Ct
- 2327 Cleveland St
- 2475 Marshall Ave
- 1582 Little Neck Ave
- 216 Stephen St
- 212 Stephen St
- 218 Stephen St
- 210 Stephen St
- 307 Lorraine St
- 309 Lorraine St
- 220 Stephen St
- 208 Stephen St
- 213 Stephen St
- 311 Lorraine St
- 215 Stephen St
- 211 Stephen St
- 305 Lorraine St
- 6 Catherine Place
- 209 Stephen St
- 222 Stephen St
- 217 Stephen St
- 5 Catherine Place
- 206 Stephen St
- 313 Lorraine St