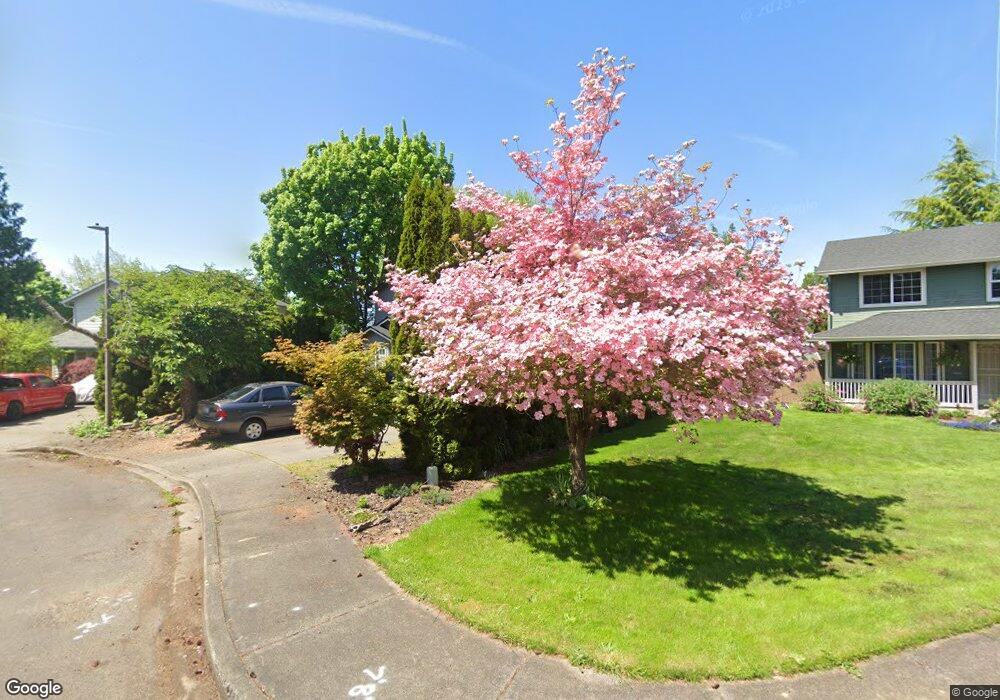
214 SW 2nd Ct Battle Ground, WA 98604
Estimated Value: $486,000 - $548,000
4
Beds
3
Baths
1,485
Sq Ft
$346/Sq Ft
Est. Value
About This Home
This home is located at 214 SW 2nd Ct, Battle Ground, WA 98604 and is currently estimated at $513,239, approximately $345 per square foot. 214 SW 2nd Ct is a home located in Clark County with nearby schools including Captain Strong Primary School, Chief Umtuch Middle School, and Battle Ground High School.
Ownership History
Date
Name
Owned For
Owner Type
Purchase Details
Closed on
Aug 19, 2003
Sold by
Tubbs Scott C and Tubbs Michelle J
Bought by
Bozung Allen Thomas and Bozung Christina L
Current Estimated Value
Home Financials for this Owner
Home Financials are based on the most recent Mortgage that was taken out on this home.
Original Mortgage
$183,717
Outstanding Balance
$79,958
Interest Rate
5.46%
Mortgage Type
FHA
Estimated Equity
$433,281
Purchase Details
Closed on
Sep 14, 2000
Sold by
Imc Mtg Corp Lp
Bought by
Tubbs Scott C and Tubbs Michelle J
Home Financials for this Owner
Home Financials are based on the most recent Mortgage that was taken out on this home.
Original Mortgage
$128,441
Interest Rate
8.11%
Mortgage Type
FHA
Purchase Details
Closed on
Oct 29, 1999
Sold by
Cortes Andrew E and Cortes Martha L
Bought by
Imc Mtg Corp Lp
Purchase Details
Closed on
Dec 22, 1995
Sold by
Girod Jon L and Girod Maria V
Bought by
Cortes Andrew E and Cortes Martha L
Home Financials for this Owner
Home Financials are based on the most recent Mortgage that was taken out on this home.
Original Mortgage
$125,716
Interest Rate
7.37%
Mortgage Type
FHA
Create a Home Valuation Report for This Property
The Home Valuation Report is an in-depth analysis detailing your home's value as well as a comparison with similar homes in the area
Home Values in the Area
Average Home Value in this Area
Purchase History
| Date | Buyer | Sale Price | Title Company |
|---|---|---|---|
| Bozung Allen Thomas | $186,600 | Cascade Title | |
| Tubbs Scott C | $129,500 | Fidelity National Title Co | |
| Imc Mtg Corp Lp | $119,000 | Chicago Title Insurance | |
| Cortes Andrew E | $127,000 | Charter Title Corp |
Source: Public Records
Mortgage History
| Date | Status | Borrower | Loan Amount |
|---|---|---|---|
| Open | Bozung Allen Thomas | $183,717 | |
| Previous Owner | Tubbs Scott C | $128,441 | |
| Previous Owner | Cortes Andrew E | $125,716 |
Source: Public Records
Tax History Compared to Growth
Tax History
| Year | Tax Paid | Tax Assessment Tax Assessment Total Assessment is a certain percentage of the fair market value that is determined by local assessors to be the total taxable value of land and additions on the property. | Land | Improvement |
|---|---|---|---|---|
| 2025 | $3,487 | $412,303 | $175,000 | $237,303 |
| 2024 | $3,012 | $427,507 | $175,000 | $252,507 |
| 2023 | $3,216 | $420,054 | $175,000 | $245,054 |
| 2022 | $3,050 | $409,001 | $155,000 | $254,001 |
| 2021 | $3,010 | $337,057 | $125,000 | $212,057 |
| 2020 | $2,563 | $305,116 | $115,000 | $190,116 |
| 2019 | $2,085 | $294,426 | $118,000 | $176,426 |
| 2018 | $2,596 | $280,206 | $0 | $0 |
| 2017 | $2,092 | $256,344 | $0 | $0 |
| 2016 | $2,076 | $224,977 | $0 | $0 |
| 2015 | $2,066 | $204,844 | $0 | $0 |
| 2014 | -- | $193,430 | $0 | $0 |
| 2013 | -- | $174,913 | $0 | $0 |
Source: Public Records
Map
Nearby Homes
- 407 SW 32nd St
- 408 S Parkway Ave
- 532 SW 23rd St
- 526 SW 23rd St
- 213 SE 1st Ave
- 300 SW 7th Ave Unit 704
- 300 SW 7th Ave Unit 905
- 300 SW 7th Ave Unit 211
- 300 SW 7th Ave Unit 302
- 300 SW 7th Ave Unit 127
- 300 SW 7th Ave Unit 102
- 300 SW 7th Ave Unit 1202
- 3309 SE 12th Ave
- 301 SW 8th St
- 12 SE 9th Cir
- 3107 4th Ave
- 3111 4th Ave
- 405 SW 10th St
- 14 SW 11th St
- 413 SE 8th St