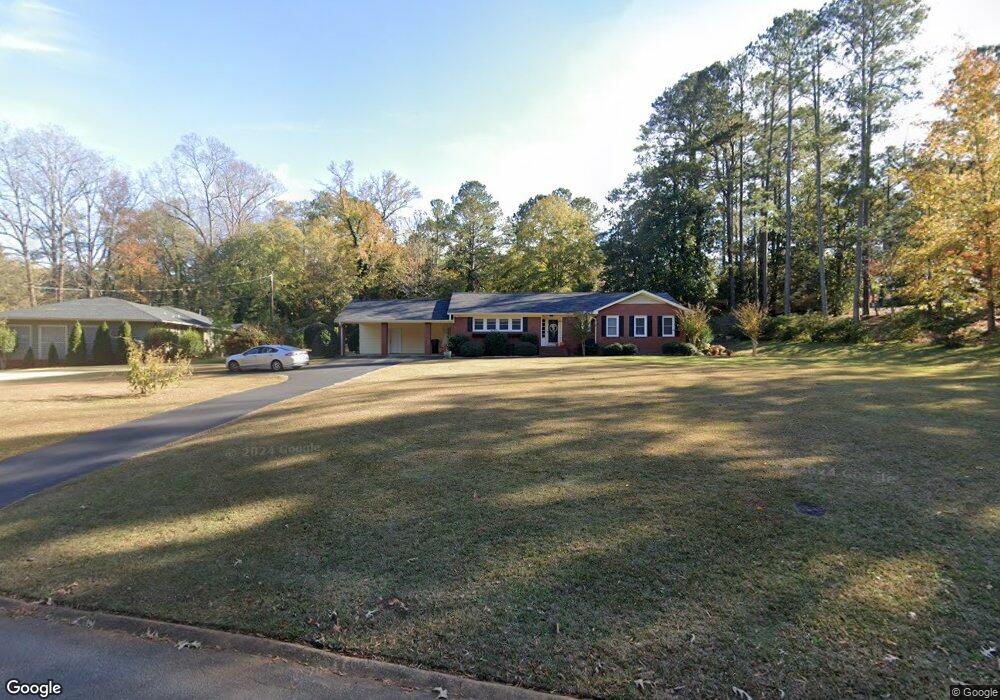
214 Teel Rd West Point, GA 31833
Estimated Value: $215,000 - $250,000
3
Beds
2
Baths
1,533
Sq Ft
$153/Sq Ft
Est. Value
About This Home
This home is located at 214 Teel Rd, West Point, GA 31833 and is currently estimated at $234,119, approximately $152 per square foot. 214 Teel Rd is a home located in Harris County with nearby schools including New Mountain Hill Elementary School, Harris County Carver Middle School, and Creekside School.
Ownership History
Date
Name
Owned For
Owner Type
Purchase Details
Closed on
Nov 30, 2020
Sold by
Cousins Diane
Bought by
Rudd Angela and Verner David
Current Estimated Value
Home Financials for this Owner
Home Financials are based on the most recent Mortgage that was taken out on this home.
Original Mortgage
$148,750
Outstanding Balance
$130,894
Interest Rate
2.8%
Mortgage Type
New Conventional
Estimated Equity
$103,225
Purchase Details
Closed on
Apr 16, 2014
Sold by
Cousins Diane
Bought by
Cousins Diane and Auler Sarah N
Purchase Details
Closed on
Aug 29, 2008
Sold by
Kerr Beverly Ann
Bought by
Cousins Diane
Home Financials for this Owner
Home Financials are based on the most recent Mortgage that was taken out on this home.
Original Mortgage
$140,443
Interest Rate
6.48%
Mortgage Type
New Conventional
Purchase Details
Closed on
Aug 19, 1988
Bought by
Kerr Beverly Ann
Create a Home Valuation Report for This Property
The Home Valuation Report is an in-depth analysis detailing your home's value as well as a comparison with similar homes in the area
Home Values in the Area
Average Home Value in this Area
Purchase History
| Date | Buyer | Sale Price | Title Company |
|---|---|---|---|
| Rudd Angela | $175,000 | -- | |
| Cousins Diane | -- | -- | |
| Cousins Diane | $143,000 | -- | |
| Kerr Beverly Ann | $65,000 | -- |
Source: Public Records
Mortgage History
| Date | Status | Borrower | Loan Amount |
|---|---|---|---|
| Open | Rudd Angela | $148,750 | |
| Previous Owner | Cousins Diane | $140,443 |
Source: Public Records
Tax History
| Year | Tax Paid | Tax Assessment Tax Assessment Total Assessment is a certain percentage of the fair market value that is determined by local assessors to be the total taxable value of land and additions on the property. | Land | Improvement |
|---|---|---|---|---|
| 2025 | $2,369 | $78,523 | $8,000 | $70,523 |
| 2024 | $2,206 | $73,812 | $8,000 | $65,812 |
| 2023 | $1,150 | $73,930 | $8,000 | $65,930 |
| 2022 | $1,537 | $70,988 | $8,000 | $62,988 |
| 2021 | $1,575 | $69,756 | $8,000 | $61,756 |
| 2020 | $995 | $45,479 | $8,000 | $37,479 |
| 2019 | $949 | $45,479 | $8,000 | $37,479 |
| 2018 | $987 | $45,479 | $8,000 | $37,479 |
| 2017 | $987 | $45,479 | $8,000 | $37,479 |
| 2016 | $912 | $44,910 | $8,000 | $36,910 |
| 2015 | $951 | $46,556 | $8,000 | $38,556 |
| 2014 | $884 | $43,463 | $8,000 | $35,463 |
| 2013 | -- | $43,462 | $8,000 | $35,462 |
Source: Public Records
Map
Nearby Homes
- 112 Hillcrest Rd
- 128 Highland Dr
- 506 E 6th St
- 707 E 7th St
- 509 Cleveland St
- 1202 E 9th St
- 900 E 9th St
- 1104 E 8th St
- 0 Arrowhead Dr Unit 10451860
- 712 4th Ave
- 302 N 6th Ave
- 1026 N 6th Ave
- 514 N 8th Ave
- 1007 4th Ave
- 1418 E 10th St
- 403 N 15th St
- 811 Cherry Dr
- 1508 N 4th Ave
- 902 1st St
- 0 Sunset Dr Unit 10451831
Your Personal Tour Guide
Ask me questions while you tour the home.