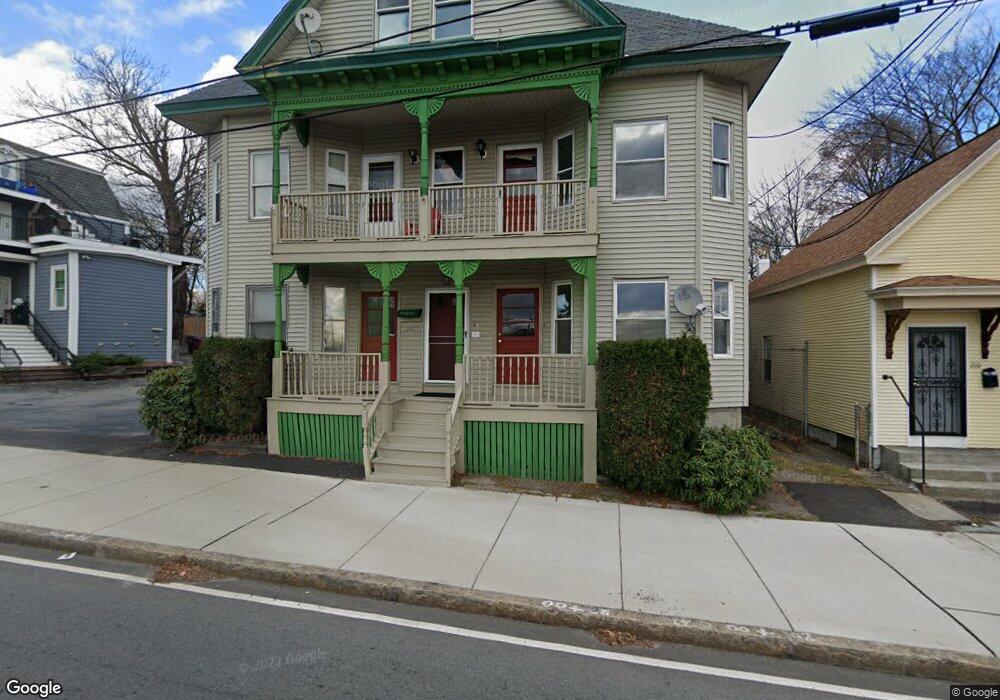
214 Thorndike St Unit 8 Lowell, MA 01852
Back Central NeighborhoodEstimated Value: $287,663 - $433,000
2
Beds
1
Bath
1,140
Sq Ft
$323/Sq Ft
Est. Value
About This Home
This home is located at 214 Thorndike St Unit 8, Lowell, MA 01852 and is currently estimated at $367,916, approximately $322 per square foot. 214 Thorndike St Unit 8 is a home located in Middlesex County with nearby schools including Abraham Lincoln Elementary School, Moody Elementary School, and Greenhalge Elementary School.
Ownership History
Date
Name
Owned For
Owner Type
Purchase Details
Closed on
Aug 8, 2011
Sold by
Thompson Carleton G
Bought by
Harris Joy E
Current Estimated Value
Purchase Details
Closed on
Dec 27, 1999
Sold by
Harris Joy E
Bought by
Thompson Carleton G
Purchase Details
Closed on
Dec 22, 1993
Sold by
Thompson Carleton and Harris Joy E
Bought by
Harris Joy E
Purchase Details
Closed on
Oct 17, 1991
Sold by
Glendale Fed Bank Fsb
Bought by
Harris Thompson Carleton G and Harris Joy E
Purchase Details
Closed on
Sep 23, 1991
Sold by
Cardelle Donald J
Bought by
Glendale Fed Bank Fsb
Purchase Details
Closed on
Feb 12, 1987
Sold by
Campbell Mark A
Bought by
Cardelle Donald J
Home Financials for this Owner
Home Financials are based on the most recent Mortgage that was taken out on this home.
Original Mortgage
$96,000
Interest Rate
9.34%
Mortgage Type
Purchase Money Mortgage
Create a Home Valuation Report for This Property
The Home Valuation Report is an in-depth analysis detailing your home's value as well as a comparison with similar homes in the area
Home Values in the Area
Average Home Value in this Area
Purchase History
| Date | Buyer | Sale Price | Title Company |
|---|---|---|---|
| Harris Joy E | -- | -- | |
| Thompson Carleton G | $12,500 | -- | |
| Harris Joy E | $12,500 | -- | |
| Harris Thompson Carleton G | $21,000 | -- | |
| Glendale Fed Bank Fsb | $46,500 | -- | |
| Cardelle Donald J | $90,000 | -- |
Source: Public Records
Mortgage History
| Date | Status | Borrower | Loan Amount |
|---|---|---|---|
| Open | Cardelle Donald J | $22,000 | |
| Previous Owner | Cardelle Donald J | $96,000 |
Source: Public Records
Tax History
| Year | Tax Paid | Tax Assessment Tax Assessment Total Assessment is a certain percentage of the fair market value that is determined by local assessors to be the total taxable value of land and additions on the property. | Land | Improvement |
|---|---|---|---|---|
| 2025 | $2,458 | $214,100 | $0 | $214,100 |
| 2024 | $2,312 | $194,100 | $0 | $194,100 |
| 2023 | $2,124 | $171,000 | $0 | $171,000 |
| 2022 | $2,013 | $158,600 | $0 | $158,600 |
| 2021 | $1,957 | $145,400 | $0 | $145,400 |
| 2020 | $1,878 | $140,600 | $0 | $140,600 |
| 2019 | $1,831 | $130,400 | $0 | $130,400 |
| 2018 | $1,717 | $119,300 | $0 | $119,300 |
| 2017 | $1,464 | $98,100 | $0 | $98,100 |
| 2016 | $1,436 | $94,700 | $0 | $94,700 |
| 2015 | $1,378 | $89,000 | $0 | $89,000 |
| 2013 | $1,521 | $101,300 | $0 | $101,300 |
Source: Public Records
Map
Nearby Homes
- 191 Thorndike St Unit 26
- 95 S Highland St
- 201 Thorndike St Unit 501
- 201 Thorndike St Unit 2-312
- 201 Thorndike St Unit 505
- 8 Cedar Ct
- 7 Butler Ave Unit 5
- 5 Floyd St
- 84 Cambridge St
- 278-316 Middlesex St
- 85 Kinsman St
- 45 Marshall St
- 39 Groves Ave
- 491 Dutton St Unit 305
- 491 Dutton St Unit 409
- 491 Dutton St Unit 504
- 31 Merrill St
- 68 Smith St
- 28 Liberty St
- 42 Branch St
- 214 Thorndike St Unit 10
- 214 Thorndike St Unit 9
- 214 Thorndike St Unit 7
- 214 Thorndike St Unit 6
- 220 Thorndike St
- 222 Thorndike St
- 58 Highland St
- 62 Highland St Unit 4
- 62 Highland St Unit 3
- 62 Highland St Unit 2
- 62 Highland St Unit 1
- 62 Highland St Unit 62 ,4
- 62 Highland St Unit 1-5
- 50 Highland St Unit 4
- 50 Highland St Unit 2
- 50 Highland St Unit 50
- 48 Highland St
- 240 Thorndike St
- 242 Thorndike St
- 195 Thorndike St Unit 26
Your Personal Tour Guide
Ask me questions while you tour the home.