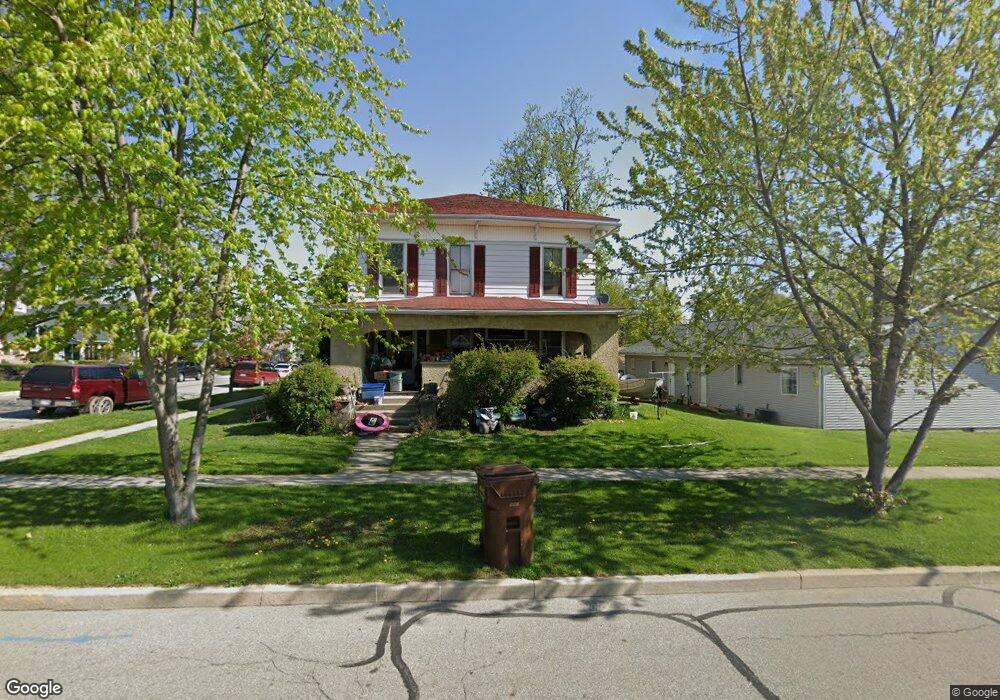
214 W Broad St Angola, IN 46703
Estimated Value: $208,000 - $239,000
3
Beds
2
Baths
2,382
Sq Ft
$95/Sq Ft
Est. Value
About This Home
This home is located at 214 W Broad St, Angola, IN 46703 and is currently estimated at $225,490, approximately $94 per square foot. 214 W Broad St is a home located in Steuben County with nearby schools including Angola High School and Grace Baptist Academy.
Ownership History
Date
Name
Owned For
Owner Type
Purchase Details
Closed on
Dec 22, 2020
Sold by
Nodine Matthew R
Bought by
Nodine Mark L
Current Estimated Value
Home Financials for this Owner
Home Financials are based on the most recent Mortgage that was taken out on this home.
Original Mortgage
$30,000
Outstanding Balance
$26,714
Interest Rate
2.71%
Mortgage Type
New Conventional
Estimated Equity
$198,776
Purchase Details
Closed on
Aug 8, 2013
Sold by
Hershey Karen Karr and Karr Karen L
Bought by
Nodine Mark
Home Financials for this Owner
Home Financials are based on the most recent Mortgage that was taken out on this home.
Original Mortgage
$48,000
Interest Rate
1%
Mortgage Type
Seller Take Back
Purchase Details
Closed on
Jun 2, 2013
Sold by
Karr Hershey Karen
Bought by
Nodine Mark
Purchase Details
Closed on
Jun 8, 1998
Sold by
Walter Ronald L and Walter Waneta M
Bought by
Karr Karen L
Create a Home Valuation Report for This Property
The Home Valuation Report is an in-depth analysis detailing your home's value as well as a comparison with similar homes in the area
Home Values in the Area
Average Home Value in this Area
Purchase History
| Date | Buyer | Sale Price | Title Company |
|---|---|---|---|
| Nodine Mark L | -- | North American Title Company | |
| Nodine Mark | $65,000 | None Available | |
| Nodine Mark | $65,000 | -- | |
| Karr Karen L | $80,000 | -- |
Source: Public Records
Mortgage History
| Date | Status | Borrower | Loan Amount |
|---|---|---|---|
| Open | Nodine Mark L | $30,000 | |
| Closed | Nodine Mark | $48,000 |
Source: Public Records
Tax History Compared to Growth
Tax History
| Year | Tax Paid | Tax Assessment Tax Assessment Total Assessment is a certain percentage of the fair market value that is determined by local assessors to be the total taxable value of land and additions on the property. | Land | Improvement |
|---|---|---|---|---|
| 2024 | $1,583 | $212,500 | $23,900 | $188,600 |
| 2023 | $1,423 | $202,400 | $22,500 | $179,900 |
| 2022 | $1,415 | $191,300 | $22,300 | $169,000 |
| 2021 | $579 | $134,500 | $20,000 | $114,500 |
| 2020 | $693 | $107,500 | $7,900 | $99,600 |
| 2019 | $721 | $107,900 | $12,000 | $95,900 |
| 2018 | $649 | $99,500 | $12,000 | $87,500 |
| 2017 | $543 | $90,000 | $12,000 | $78,000 |
| 2016 | $398 | $80,100 | $12,000 | $68,100 |
| 2014 | $372 | $77,900 | $12,000 | $65,900 |
| 2013 | $372 | $78,600 | $12,000 | $66,600 |
Source: Public Records
Map
Nearby Homes
- 109 E Broad St
- TBD U S 20
- 308 E Broad St
- 311 S Superior St
- 406 S Wayne St
- 513 S Wayne St
- 600 E Maumee St
- 312 W Pleasant St
- 120 Powers St
- 214 Powers St
- 700 Apple Hill Way
- 421 Manahan Dr
- 814 Apple Hill Way
- 107 W Felicity St
- 308 Clyde Ave
- 405 Hilltop Dr
- 941 E Maumee St
- 1003 Crestview Dr
- 1045 S West St
- 1007 S Superior St
- 310 N West St
- 210 W Broad St
- 312 N West St
- 305 N West St
- 206 W Broad St
- 309 N West St
- 300 W Broad St
- 309 N Elizabeth St
- 315 N West St
- 202 W Broad St
- 313 N Elizabeth St
- 401 N W
- 305 W Broad St
- 401 N West St
- 401 N Elizabeth St
- 404 N West St
- 307 W Broad St
- 308 N Superior St
- 314 N Superior St
- 405 N West St