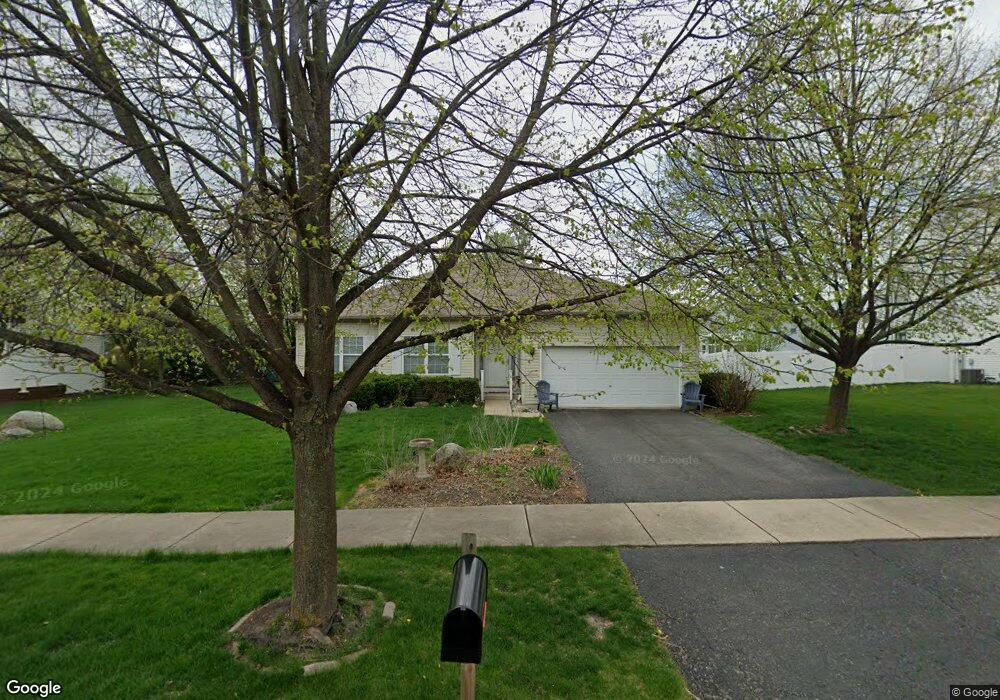
214 White Oak Dr North Aurora, IL 60542
Estimated Value: $383,000 - $402,790
3
Beds
2
Baths
1,629
Sq Ft
$241/Sq Ft
Est. Value
About This Home
This home is located at 214 White Oak Dr, North Aurora, IL 60542 and is currently estimated at $393,198, approximately $241 per square foot. 214 White Oak Dr is a home located in Kane County with nearby schools including Fearn Elementary School, Jewel Middle School, and West Aurora High School.
Ownership History
Date
Name
Owned For
Owner Type
Purchase Details
Closed on
Oct 2, 2019
Sold by
Sheldon Jan A
Bought by
Sheldon Jan A and Jan A Sheldon 2019 Living Trus
Current Estimated Value
Purchase Details
Closed on
Jun 30, 2006
Sold by
Priban Robert J and Priban Carla J
Bought by
Sheldon Jan A
Home Financials for this Owner
Home Financials are based on the most recent Mortgage that was taken out on this home.
Original Mortgage
$168,000
Outstanding Balance
$100,177
Interest Rate
6.73%
Mortgage Type
Purchase Money Mortgage
Estimated Equity
$293,021
Purchase Details
Closed on
Jun 10, 1998
Sold by
Waterford Homes Inc
Bought by
Priban Robert J and Priban Carla J
Home Financials for this Owner
Home Financials are based on the most recent Mortgage that was taken out on this home.
Original Mortgage
$80,000
Interest Rate
7.32%
Create a Home Valuation Report for This Property
The Home Valuation Report is an in-depth analysis detailing your home's value as well as a comparison with similar homes in the area
Home Values in the Area
Average Home Value in this Area
Purchase History
| Date | Buyer | Sale Price | Title Company |
|---|---|---|---|
| Sheldon Jan A | -- | Attorney | |
| Sheldon Jan A | $298,000 | Pntn | |
| Priban Robert J | $179,500 | First American Title Ins Co | |
| Waterford Homes Inc | -- | First American Title Ins Co |
Source: Public Records
Mortgage History
| Date | Status | Borrower | Loan Amount |
|---|---|---|---|
| Open | Sheldon Jan A | $168,000 | |
| Previous Owner | Priban Robert J | $80,000 |
Source: Public Records
Tax History Compared to Growth
Tax History
| Year | Tax Paid | Tax Assessment Tax Assessment Total Assessment is a certain percentage of the fair market value that is determined by local assessors to be the total taxable value of land and additions on the property. | Land | Improvement |
|---|---|---|---|---|
| 2024 | $7,562 | $114,008 | $23,352 | $90,656 |
| 2023 | $7,163 | $101,866 | $20,865 | $81,001 |
| 2022 | $6,952 | $92,943 | $19,037 | $73,906 |
| 2021 | $6,563 | $86,531 | $17,724 | $68,807 |
| 2020 | $6,915 | $89,143 | $16,463 | $72,680 |
| 2019 | $6,662 | $82,593 | $15,253 | $67,340 |
| 2018 | $6,466 | $78,153 | $14,109 | $64,044 |
| 2017 | $6,558 | $77,430 | $16,238 | $61,192 |
| 2016 | $7,199 | $76,727 | $13,919 | $62,808 |
| 2015 | -- | $65,699 | $11,969 | $53,730 |
| 2014 | -- | $61,573 | $11,512 | $50,061 |
| 2013 | -- | $62,089 | $11,348 | $50,741 |
Source: Public Records
Map
Nearby Homes
- 413 Messenger Cir
- 201 Hidden Creek Ln Unit 301
- 311 Hidden Creek Ln Unit 311
- 1640 Abington Ln
- 71 Windstone Dr
- 1202 Fox Hill Ln Unit 362
- 109 E Victoria Cir Unit 7/5
- 203 E Victoria Cir Unit 9/2
- 1432 Hartsburg Ln Unit 1
- 1403 Prairie Ct
- 316 E Victoria Cir Unit 125
- 420 Hidden Creek Ln Unit 65
- Lot 16 West Orchard Gateway Blvd
- Lot 1 North Orchard Gateway Blvd
- Lot 16 Orchard Gateway Blvd
- 1638 Patterson Ave
- 1615 Patterson Ave
- 1687 Breton Ave
- 867 Fair Meadow Ct
- 1670 Patterson Ave
- 222 White Oak Dr
- 206 White Oak Dr
- 1454 Westbury Cir
- 1446 Westbury Cir
- 1462 Westbury Cir
- 230 White Oak Dr
- 209 Spring Ct
- 198 White Oak Dr
- 1470 Westbury Cir
- 1430 Westbury Cir
- 238 White Oak Dr
- 190 White Oak Dr
- 241 Spring Ct
- 199 White Oak Dr
- 217 Spring Ct
- 1449 Westbury Cir
- 1489 Westbury Cir
- 233 Spring Ct
- 225 Spring Ct
- 1478 Westbury Cir