Estimated Value: $146,000 - $198,000
--
Bed
--
Bath
884
Sq Ft
$183/Sq Ft
Est. Value
About This Home
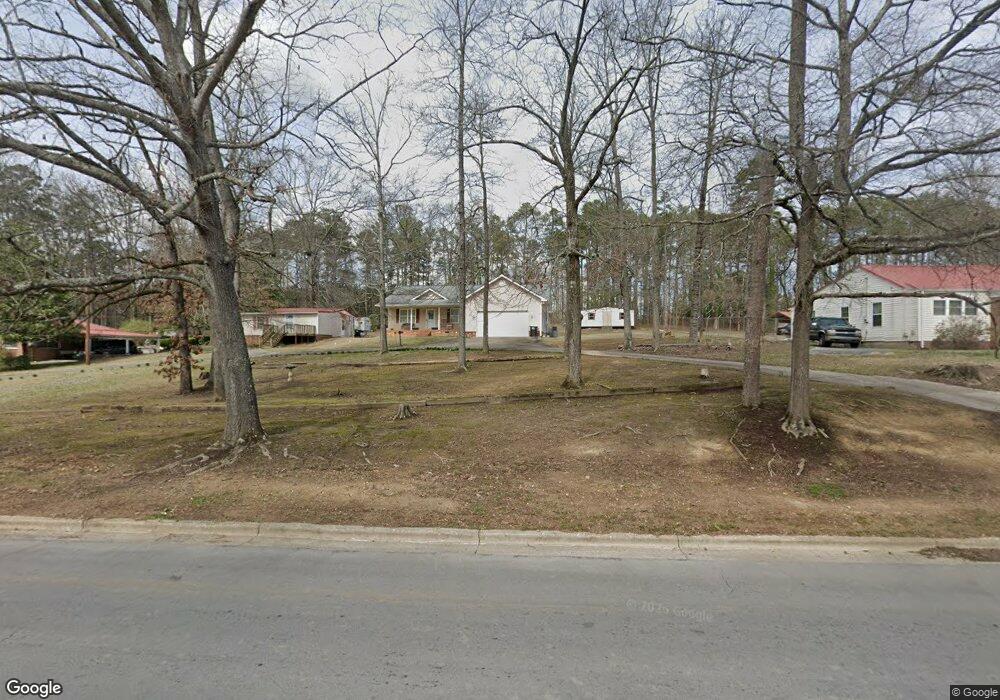
This home is located at 214 Woodbine Ave NW, Rome, GA 30165 and is currently estimated at $162,057, approximately $183 per square foot. 214 Woodbine Ave NW is a home located in Floyd County with nearby schools including Rome High School and St. Mary School.
Ownership History
Date
Name
Owned For
Owner Type
Purchase Details
Closed on
May 17, 2011
Sold by
Storey Steven Bradley
Bought by
Storey Shirley Yvonne
Current Estimated Value
Purchase Details
Closed on
May 10, 2011
Sold by
Storey Shirley Yvonne
Bought by
Storey Shirley Yvonne
Purchase Details
Closed on
Aug 26, 1988
Sold by
Storey James C
Bought by
Storey James C and Storey Yvonne
Purchase Details
Closed on
Nov 17, 1976
Sold by
Hines Thomas E
Bought by
Storey James C
Purchase Details
Closed on
Apr 26, 1974
Sold by
Johnson R L
Bought by
Hines Thomas E
Purchase Details
Closed on
Aug 27, 1973
Sold by
Mccord J C
Bought by
Johnson R L
Purchase Details
Closed on
Jul 10, 1967
Sold by
Johnson R L
Bought by
Mccord J C
Purchase Details
Closed on
Jun 1, 1965
Sold by
Johnson R L Mrs Jr Underwood John R
Bought by
Johnson R L
Purchase Details
Closed on
Jan 1, 1901
Bought by
Johnson R L Mrs Jr Underwood John R
Create a Home Valuation Report for This Property
The Home Valuation Report is an in-depth analysis detailing your home's value as well as a comparison with similar homes in the area
Home Values in the Area
Average Home Value in this Area
Purchase History
| Date | Buyer | Sale Price | Title Company |
|---|---|---|---|
| Storey Shirley Yvonne | -- | -- | |
| Storey Shirley Yvonne | -- | -- | |
| Storey James C | -- | -- | |
| Storey James C | $36,000 | -- | |
| Hines Thomas E | $38,500 | -- | |
| Johnson R L | $6,000 | -- | |
| Mccord J C | $214,500 | -- | |
| Johnson R L | -- | -- | |
| Johnson R L Mrs Jr Underwood John R | -- | -- |
Source: Public Records
Tax History Compared to Growth
Tax History
| Year | Tax Paid | Tax Assessment Tax Assessment Total Assessment is a certain percentage of the fair market value that is determined by local assessors to be the total taxable value of land and additions on the property. | Land | Improvement |
|---|---|---|---|---|
| 2024 | $1,656 | $74,318 | $19,900 | $54,418 |
| 2023 | $1,135 | $53,471 | $17,689 | $35,782 |
| 2022 | $1,108 | $50,555 | $14,741 | $35,814 |
| 2021 | $1,015 | $46,991 | $14,741 | $32,250 |
| 2020 | $919 | $41,987 | $11,056 | $30,931 |
| 2019 | $870 | $40,631 | $11,056 | $29,575 |
| 2018 | $892 | $41,929 | $11,056 | $30,873 |
| 2017 | $871 | $41,109 | $11,056 | $30,053 |
| 2016 | $927 | $43,452 | $11,040 | $32,412 |
| 2015 | $816 | $43,732 | $11,040 | $32,692 |
| 2014 | $816 | $42,448 | $11,040 | $31,408 |
Source: Public Records
Map
Nearby Homes
- 212 Woodbine Ave NW
- 220 Woodbine Ave NW
- 210 Woodbine Ave NW
- 222 Woodbine Ave NW
- 208 Woodbine Ave NW
- 221 Woodbine Ave NW
- 219 Woodbine Ave NW
- 224 Woodbine Ave NW Unit PT 163
- 224 Woodbine Ave NW
- 223 Woodbine Ave NW
- 217 Woodbine Ave NW
- 225 Woodbine Ave NW
- 0 Woodbine Ave NW Unit 7511786
- 0 Woodbine Ave NW Unit 7169181
- 0 Woodbine Ave NW Unit 7149968
- 0 Woodbine Ave NW Unit 3263097
- 0 Woodbine Ave NW Unit 8322666
- 0 Woodbine Ave NW Unit 8224674
- 0 Woodbine Ave NW Unit 8221524
- 0 Woodbine Ave NW Unit 7114046