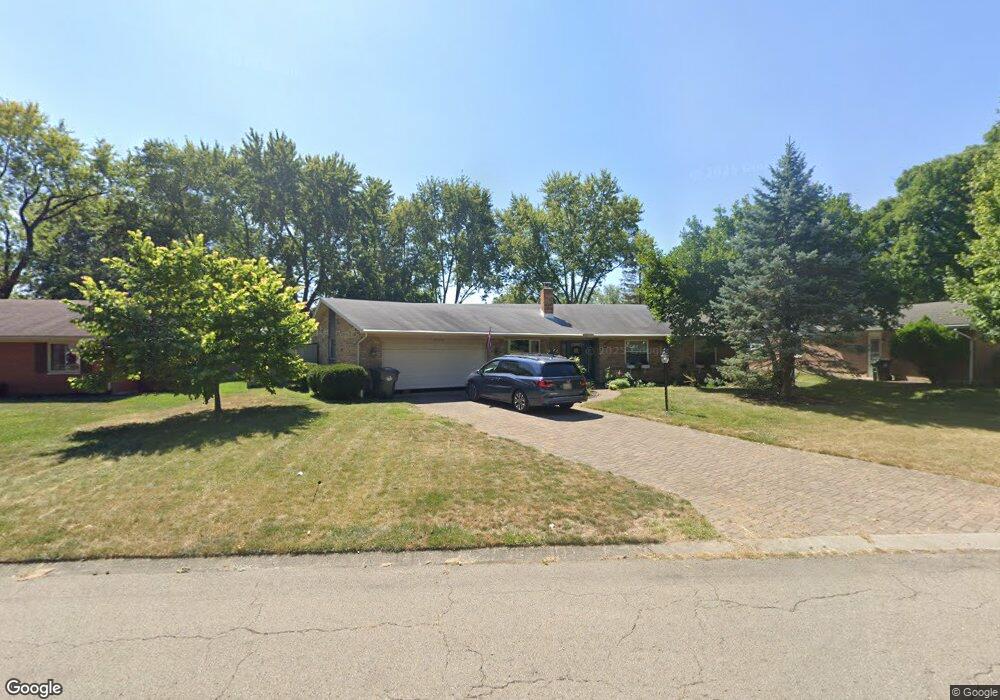
2140 Oak Tree Dr E Dayton, OH 45440
Estimated Value: $326,779 - $378,000
3
Beds
2
Baths
2,133
Sq Ft
$163/Sq Ft
Est. Value
About This Home
This home is located at 2140 Oak Tree Dr E, Dayton, OH 45440 and is currently estimated at $346,945, approximately $162 per square foot. 2140 Oak Tree Dr E is a home located in Montgomery County with nearby schools including John F. Kennedy Elementary School, Kettering Middle School, and Kettering Fairmont High School.
Ownership History
Date
Name
Owned For
Owner Type
Purchase Details
Closed on
Jun 2, 2020
Sold by
Jones Frank L and Jones Christine
Bought by
Brinkman Timothy P and Brinkman Jessica E
Current Estimated Value
Home Financials for this Owner
Home Financials are based on the most recent Mortgage that was taken out on this home.
Original Mortgage
$232,200
Interest Rate
3.1%
Mortgage Type
New Conventional
Purchase Details
Closed on
Jan 4, 2017
Sold by
Jacobs William T
Bought by
Jones Frank L and Jones Christene
Home Financials for this Owner
Home Financials are based on the most recent Mortgage that was taken out on this home.
Original Mortgage
$100,000
Interest Rate
4.16%
Mortgage Type
Seller Take Back
Purchase Details
Closed on
Sep 2, 2010
Sold by
Estate Of William Ralph Jacobs
Bought by
Jacobs Peggy
Create a Home Valuation Report for This Property
The Home Valuation Report is an in-depth analysis detailing your home's value as well as a comparison with similar homes in the area
Home Values in the Area
Average Home Value in this Area
Purchase History
| Date | Buyer | Sale Price | Title Company |
|---|---|---|---|
| Brinkman Timothy P | $263,000 | M&M Title | |
| Jones Frank L | $130,000 | None Available | |
| Jacobs Peggy | -- | None Available |
Source: Public Records
Mortgage History
| Date | Status | Borrower | Loan Amount |
|---|---|---|---|
| Previous Owner | Brinkman Timothy P | $232,200 | |
| Previous Owner | Jones Frank L | $100,000 |
Source: Public Records
Tax History
| Year | Tax Paid | Tax Assessment Tax Assessment Total Assessment is a certain percentage of the fair market value that is determined by local assessors to be the total taxable value of land and additions on the property. | Land | Improvement |
|---|---|---|---|---|
| 2025 | $5,487 | $85,970 | $17,100 | $68,870 |
| 2024 | $5,330 | $85,970 | $17,100 | $68,870 |
| 2023 | $5,330 | $85,970 | $17,100 | $68,870 |
| 2022 | $5,191 | $66,210 | $13,150 | $53,060 |
| 2021 | $4,800 | $66,210 | $13,150 | $53,060 |
| 2020 | $4,815 | $66,210 | $13,150 | $53,060 |
| 2019 | $4,488 | $54,610 | $13,150 | $41,460 |
| 2018 | $4,512 | $54,610 | $13,150 | $41,460 |
| 2017 | $3,493 | $54,610 | $13,150 | $41,460 |
| 2016 | $3,237 | $48,660 | $13,150 | $35,510 |
| 2015 | $3,092 | $48,660 | $13,150 | $35,510 |
| 2014 | $3,092 | $48,660 | $13,150 | $35,510 |
| 2012 | -- | $48,100 | $12,990 | $35,110 |
Source: Public Records
Map
Nearby Homes
- 5195 Bigger Rd
- 5324 Glendon Ln
- 5335 Glendon Ln
- 2409 E Rahn Rd
- 5413 Newell Dr
- 2324 Belloak Dr
- 5346 Millcreek Rd
- 5172 Polen Dr
- 2312 E Whipp Rd
- 4901 Polen Dr
- 4769 Bigger Rd
- 2546 Marscott Dr
- 4678 Bigger Rd
- 2132 Hewitt Ave Unit 12132
- 5508 Red Coach Rd
- 6046 N Quinella Way Unit 51246
- 2286 Millwood Rd
- 6067 Hackamore Trail Unit 20
- 5336 Red Coach Rd
- 5526 Red Coach Rd
- 2132 Oak Tree Dr E
- 2148 Oak Tree Dr E
- 2277 E Rahn Rd
- 2269 E Rahn Rd
- 2285 E Rahn Rd
- 2156 Oak Tree Dr E
- 5200 Bigger Rd
- 2141 Oak Tree Dr E
- 2133 Oak Tree Dr E
- 2293 E Rahn Rd
- 5212 Bigger Rd
- 2149 Oak Tree Dr E
- 2125 Oak Tree Dr E
- 2164 Oak Tree Dr E
- 2309 E Rahn Rd
- 2157 Oak Tree Dr E
- 2160 Broadbent Way
- 5184 Bigger Rd
- 2152 Broadbent Way
- 5201 Bigger Rd
Your Personal Tour Guide
Ask me questions while you tour the home.