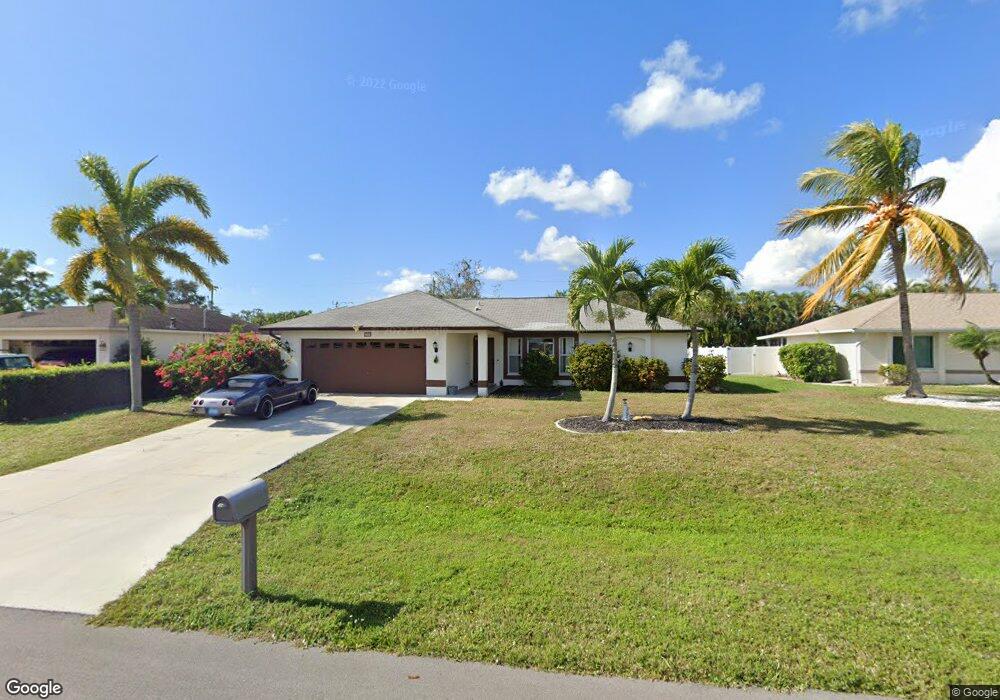
2140 SE 8th Place Cape Coral, FL 33990
Hancock NeighborhoodEstimated Value: $271,905 - $306,000
3
Beds
2
Baths
1,376
Sq Ft
$210/Sq Ft
Est. Value
About This Home
This home is located at 2140 SE 8th Place, Cape Coral, FL 33990 and is currently estimated at $288,726, approximately $209 per square foot. 2140 SE 8th Place is a home located in Lee County with nearby schools including Caloosa Elementary School, Cape Elementary School, and Tropic Isles Elementary School.
Ownership History
Date
Name
Owned For
Owner Type
Purchase Details
Closed on
May 25, 2021
Sold by
Ram Swfl Llc
Bought by
Ram Swfl Llc
Current Estimated Value
Purchase Details
Closed on
Oct 25, 2013
Sold by
Nationstar Mortgage Llc
Bought by
Ram Swfl Llc
Purchase Details
Closed on
Jul 9, 2013
Sold by
Russo Albert M
Bought by
Nationstar Mortgage Llc
Purchase Details
Closed on
Dec 18, 2004
Sold by
Pallerino John T
Bought by
Russo Albert M
Home Financials for this Owner
Home Financials are based on the most recent Mortgage that was taken out on this home.
Original Mortgage
$131,175
Interest Rate
5.87%
Mortgage Type
Unknown
Purchase Details
Closed on
Apr 28, 2000
Sold by
Sw Fl Inc
Bought by
Pallerino John T
Home Financials for this Owner
Home Financials are based on the most recent Mortgage that was taken out on this home.
Original Mortgage
$54,535
Interest Rate
8.23%
Create a Home Valuation Report for This Property
The Home Valuation Report is an in-depth analysis detailing your home's value as well as a comparison with similar homes in the area
Home Values in the Area
Average Home Value in this Area
Purchase History
| Date | Buyer | Sale Price | Title Company |
|---|---|---|---|
| Ram Swfl Llc | -- | None Available | |
| Ram Swfl Llc | $85,100 | Buyers Title Inc | |
| Nationstar Mortgage Llc | $91,200 | None Available | |
| Russo Albert M | $174,900 | Paradise Title Services Inc | |
| Pallerino John T | $83,900 | -- |
Source: Public Records
Mortgage History
| Date | Status | Borrower | Loan Amount |
|---|---|---|---|
| Previous Owner | Russo Albert M | $131,175 | |
| Previous Owner | Pallerino John T | $54,535 | |
| Closed | Russo Albert M | $26,235 |
Source: Public Records
Tax History Compared to Growth
Tax History
| Year | Tax Paid | Tax Assessment Tax Assessment Total Assessment is a certain percentage of the fair market value that is determined by local assessors to be the total taxable value of land and additions on the property. | Land | Improvement |
|---|---|---|---|---|
| 2025 | $4,234 | $230,188 | -- | -- |
| 2024 | $4,099 | $209,262 | -- | -- |
| 2023 | $4,099 | $190,238 | $0 | $0 |
| 2022 | $3,672 | $172,944 | $0 | $0 |
| 2021 | $3,285 | $157,394 | $31,000 | $126,394 |
| 2020 | $3,119 | $142,929 | $30,000 | $112,929 |
| 2019 | $2,947 | $134,856 | $28,000 | $106,856 |
| 2018 | $2,965 | $136,468 | $25,000 | $111,468 |
| 2017 | $2,879 | $138,887 | $18,000 | $120,887 |
| 2016 | $2,576 | $114,653 | $18,000 | $96,653 |
| 2015 | $2,369 | $98,898 | $15,100 | $83,798 |
| 2014 | -- | $97,505 | $15,040 | $82,465 |
| 2013 | -- | $84,592 | $10,800 | $73,792 |
Source: Public Records
Map
Nearby Homes
- 1449 SE 22nd St
- 2114 SE 8th Place
- 627 SE 22nd Terrace
- 908 SE 21st Terrace
- 610 SE 22nd Terrace
- 2016 Academy Blvd
- 2201 SE 10th Ave
- 2326 SE 8th Ave
- 624 SE 23rd Terrace
- 622 SE 20th St
- 1942 SE 8th Place
- 915 SE 20th St
- 2416 SE 8th Ave
- 910 SE 19th Ln
- 624 SE 19th Ln
- 2419 Country Club Blvd
- 2221 SE 5th Place
- 1927 SE 10th Ave
- 1914 Country Club Blvd
- 2114 SE 11th Place
- 2136 SE 8th Place
- 2144 SE 8th Place
- 2139 SE 8th Ave
- 2135 SE 8th Ave Unit 25
- 2143 SE 8th Ave
- 2148 SE 8th Place
- 2139 SE 8th Place
- 2132 SE 8th Place
- 2131 SE 8th Ave
- 2147 SE 8th Ave
- 2133 SE 8th Place
- 2147 SE 8th Place
- 2127 SE 8th Ave
- 2126 SE 8th Place
- 2127 SE 8th Place Unit 21
- 2140 SE 8th Ave
- 2138 Country Club Blvd
- 2142 Country Club Blvd
- 2202 SE 8th Place Unit 21
- 2136 SE 8th Ave