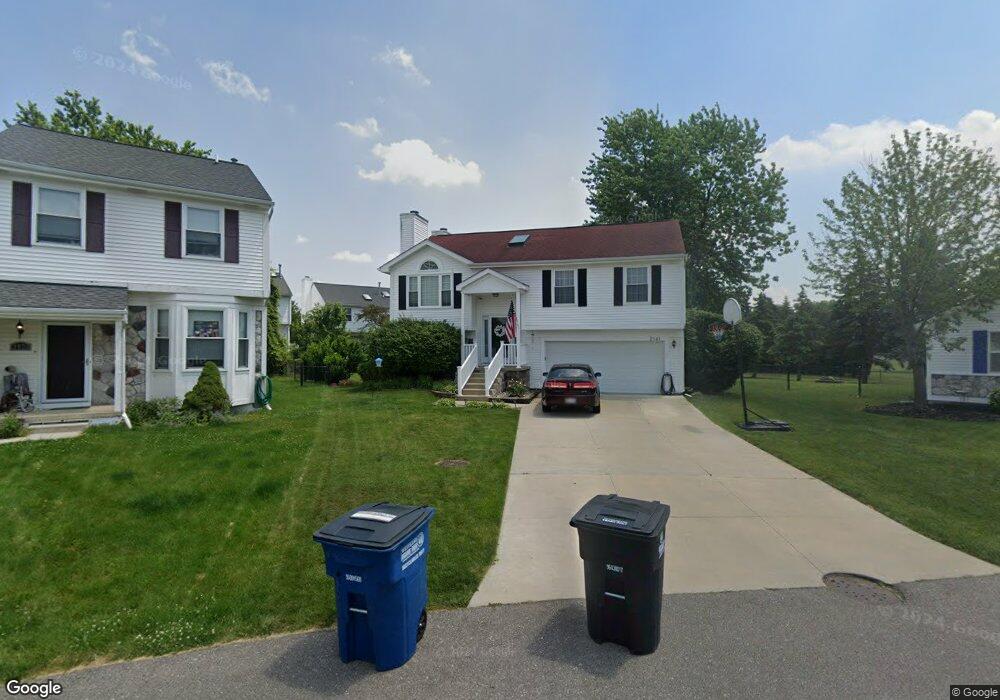
2141 Buchanan Ct Unit 140 Westland, MI 48186
Estimated Value: $299,000 - $332,000
--
Bed
2
Baths
1,597
Sq Ft
$198/Sq Ft
Est. Value
About This Home
This home is located at 2141 Buchanan Ct Unit 140, Westland, MI 48186 and is currently estimated at $316,490, approximately $198 per square foot. 2141 Buchanan Ct Unit 140 is a home located in Wayne County with nearby schools including Adlai Stevenson Middle School, Wayne Memorial High School, and St Michael Lutheran School.
Ownership History
Date
Name
Owned For
Owner Type
Purchase Details
Closed on
May 11, 2004
Sold by
Agnew Brian
Bought by
Agnew Brian
Current Estimated Value
Home Financials for this Owner
Home Financials are based on the most recent Mortgage that was taken out on this home.
Original Mortgage
$208,207
Outstanding Balance
$100,017
Interest Rate
5.85%
Mortgage Type
FHA
Estimated Equity
$216,473
Purchase Details
Closed on
May 7, 2004
Sold by
Lucas Jody and Roe Jody A
Bought by
Agnew Brian
Home Financials for this Owner
Home Financials are based on the most recent Mortgage that was taken out on this home.
Original Mortgage
$208,207
Outstanding Balance
$100,017
Interest Rate
5.85%
Mortgage Type
FHA
Estimated Equity
$216,473
Purchase Details
Closed on
Oct 15, 2002
Sold by
Kelly Richard S and Kelly Lisandra Q
Bought by
Roe Jody A
Purchase Details
Closed on
Jan 7, 1996
Sold by
Bea Bret M and Bea Christine K
Bought by
Francis X Danczyk
Create a Home Valuation Report for This Property
The Home Valuation Report is an in-depth analysis detailing your home's value as well as a comparison with similar homes in the area
Home Values in the Area
Average Home Value in this Area
Purchase History
| Date | Buyer | Sale Price | Title Company |
|---|---|---|---|
| Agnew Brian | -- | -- | |
| Agnew Brian | $213,000 | 1St Security Title Agency In | |
| Roe Jody A | $172,000 | -- | |
| Francis X Danczyk | $126,000 | -- |
Source: Public Records
Mortgage History
| Date | Status | Borrower | Loan Amount |
|---|---|---|---|
| Open | Agnew Brian | $208,207 |
Source: Public Records
Tax History Compared to Growth
Tax History
| Year | Tax Paid | Tax Assessment Tax Assessment Total Assessment is a certain percentage of the fair market value that is determined by local assessors to be the total taxable value of land and additions on the property. | Land | Improvement |
|---|---|---|---|---|
| 2025 | $2,653 | $132,900 | $0 | $0 |
| 2024 | $2,653 | $123,700 | $0 | $0 |
| 2023 | $2,534 | $99,800 | $0 | $0 |
| 2022 | $2,876 | $94,000 | $0 | $0 |
| 2021 | $2,805 | $87,400 | $0 | $0 |
| 2020 | $2,775 | $80,900 | $0 | $0 |
| 2019 | $2,674 | $75,700 | $0 | $0 |
| 2018 | $2,084 | $69,500 | $0 | $0 |
| 2017 | $855 | $64,000 | $0 | $0 |
| 2016 | $2,574 | $60,700 | $0 | $0 |
| 2015 | $5,117 | $57,480 | $0 | $0 |
| 2013 | $4,957 | $51,920 | $0 | $0 |
| 2012 | $2,424 | $50,580 | $0 | $0 |
Source: Public Records
Map
Nearby Homes
- 38185 Palmateer Rd
- 2601 Dagner Dr
- 38692 Watson Cir
- 1639 Tulip Ln
- 1786 Daisey Ln Unit 32
- 3020 Rivers Edge Dr
- 3018 Rivers Edge Dr N
- 3329 S Newburgh Rd
- 00000 Avondale St
- 2610 Hannan Rd
- 2618 Hannan Rd
- 2268 Minerva St
- 00 S Newburgh Rd
- 0 S Newburgh Rd
- 2232 Wilshire St
- 39258 Avondale St
- 36795 Greenbush Rd
- 3490 Hannan Rd
- 39288 Nottingham St
- 44312 Wilmington Dr
- 2161 Buchanan Ct Unit 139
- 2121 Buchanan Ct Unit Bldg-Unit
- 2121 Buchanan Ct Unit 141
- 2230 W Miller Cir Unit 58
- 2210 W Miller Cir
- 2250 W Miller Cir
- 2101 Buchanan Ct Unit 142
- 2181 Buchanan Ct
- 2190 W Miller Cir Unit 56
- 2270 W Miller Cir Unit 60
- 2170 W Miller Cir
- 2081 Buchanan Ct
- 2240 Buchanan Ct Unit 130
- 2201 Buchanan Ct Unit 137
- 2290 W Miller Cir Unit 61
- 2413 Barns Dr Unit Bldg-Unit
- 2413 Barns Dr
- 38310 Shelby Dr
- 2150 W Miller Cir Unit 54
- 2061 Buchanan Ct