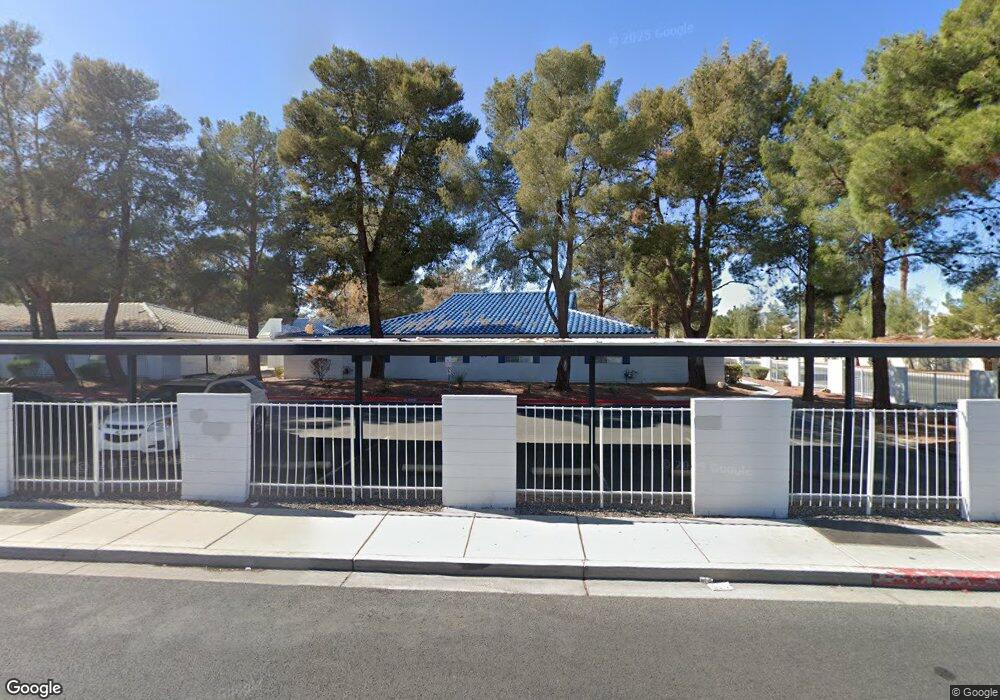
2141 Twickenham Place Unit B Las Vegas, NV 89108
Michael Way NeighborhoodEstimated Value: $195,782 - $229,000
2
Beds
2
Baths
728
Sq Ft
$297/Sq Ft
Est. Value
About This Home
This home is located at 2141 Twickenham Place Unit B, Las Vegas, NV 89108 and is currently estimated at $216,196, approximately $296 per square foot. 2141 Twickenham Place Unit B is a home located in Clark County with nearby schools including Lilly & Wing Fong Elementary School, J. Harold Brinley Middle School, and Cimarron Memorial High School.
Ownership History
Date
Name
Owned For
Owner Type
Purchase Details
Closed on
Jun 13, 2011
Sold by
Secretary Of Housing & Urban Development
Bought by
Wallace David and Wallace Sherylyn
Current Estimated Value
Purchase Details
Closed on
Sep 16, 2010
Sold by
Heyns John
Bought by
Bank Of America Na
Purchase Details
Closed on
Nov 25, 1996
Sold by
Lasco John P and Lasco Jayne L
Bought by
Heyns John
Home Financials for this Owner
Home Financials are based on the most recent Mortgage that was taken out on this home.
Original Mortgage
$60,250
Interest Rate
7.91%
Mortgage Type
FHA
Create a Home Valuation Report for This Property
The Home Valuation Report is an in-depth analysis detailing your home's value as well as a comparison with similar homes in the area
Home Values in the Area
Average Home Value in this Area
Purchase History
| Date | Buyer | Sale Price | Title Company |
|---|---|---|---|
| Wallace David | $36,000 | Nevada Title Las Vegas | |
| Bank Of America Na | $56,222 | Accommodation | |
| The Secretary Of Housing & Urban Develop | $56,222 | Fidelity National Default S | |
| Heyns John | $62,000 | First American Title Co |
Source: Public Records
Mortgage History
| Date | Status | Borrower | Loan Amount |
|---|---|---|---|
| Previous Owner | Heyns John | $60,250 |
Source: Public Records
Tax History Compared to Growth
Tax History
| Year | Tax Paid | Tax Assessment Tax Assessment Total Assessment is a certain percentage of the fair market value that is determined by local assessors to be the total taxable value of land and additions on the property. | Land | Improvement |
|---|---|---|---|---|
| 2025 | $636 | $34,624 | $15,295 | $19,329 |
| 2024 | $590 | $34,624 | $15,295 | $19,329 |
| 2023 | $590 | $37,795 | $19,618 | $18,177 |
| 2022 | $546 | $33,681 | $16,293 | $17,388 |
| 2021 | $506 | $29,105 | $14,298 | $14,807 |
| 2020 | $467 | $29,538 | $13,965 | $15,573 |
| 2019 | $438 | $27,312 | $11,970 | $15,342 |
| 2018 | $418 | $20,171 | $5,320 | $14,851 |
| 2017 | $656 | $19,999 | $5,040 | $14,959 |
| 2016 | $397 | $18,996 | $4,410 | $14,586 |
| 2015 | $395 | $15,537 | $3,150 | $12,387 |
| 2014 | $382 | $11,685 | $3,150 | $8,535 |
Source: Public Records
Map
Nearby Homes
- 2141 Twickenham Place Unit D
- 2120 Chertsey Dr Unit D
- 2120 Chertsey Dr Unit C
- 2128 Chertsey Dr Unit C
- 2132 Chertsey Dr Unit B
- 2132 Chertsey Dr Unit D
- 6457 Blue Blossom Ave
- 2121 Chertsey Dr Unit D
- 6324 Eugene Ave
- 2140 Willowbury Dr Unit A
- 2204 Short Pine Dr
- 2108 Willowbury Dr Unit B
- 2120 Willowbury Dr Unit C
- 2112 Willowbury Dr Unit B
- 2248 Short Pine Dr
- 2140 Bavington Dr Unit B
- 2128 Bavington Dr Unit A
- 6412 Big Pine Way
- 2116 Bavington Dr Unit C
- 2136 Bavington Dr Unit A
- 2141 Twickenham Place
- 2140 Petersham Ct Unit A
- 2140 Petersham Ct Unit D
- 2140 Petersham Ct Unit B
- 2128 Petersham Ct Unit D
- 2128 Petersham Ct Unit B
- 2128 Petersham Ct Unit C
- 2128 Petersham Ct Unit A
- 2136 Petersham Ct
- 2136 Petersham Ct Unit D
- 2136 Petersham Ct Unit A
- 2136 Petersham Ct Unit C
- 2136 Petersham Ct Unit B
- 6413 Melody Rose Ave
- 6405 Melody Rose Ave
- 6409 Melody Rose Ave
- 6401 Melody Rose Ave