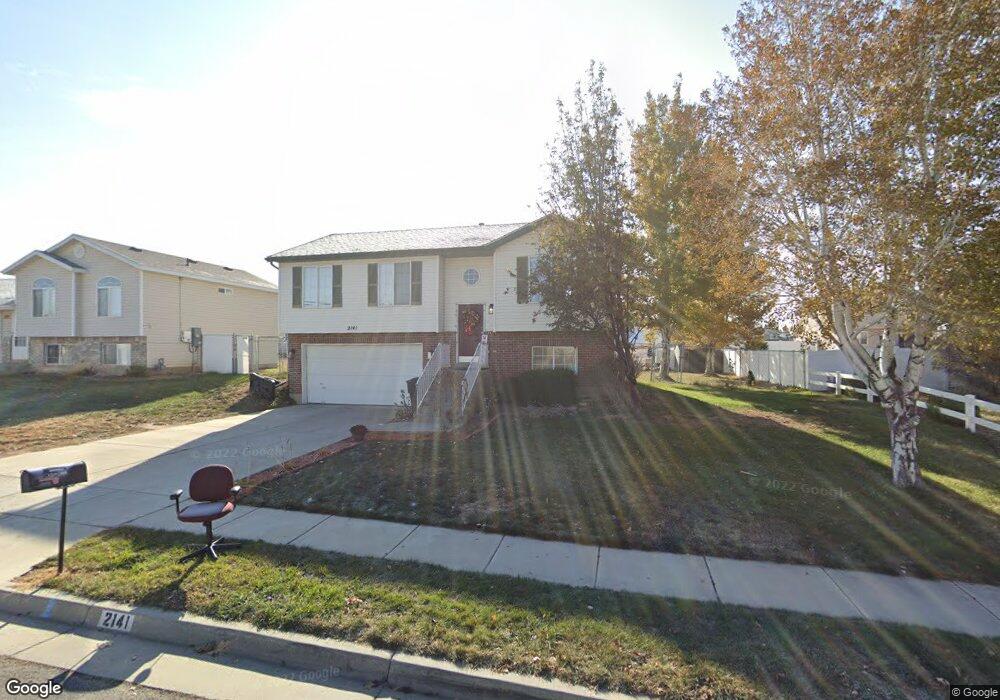
2141 W 1520 N Clearfield, UT 84015
Estimated Value: $424,000 - $456,000
4
Beds
2
Baths
1,558
Sq Ft
$283/Sq Ft
Est. Value
About This Home
This home is located at 2141 W 1520 N, Clearfield, UT 84015 and is currently estimated at $440,494, approximately $282 per square foot. 2141 W 1520 N is a home located in Davis County with nearby schools including Parkside Elementary School, West Point Junior High School, and Clearfield High School.
Ownership History
Date
Name
Owned For
Owner Type
Purchase Details
Closed on
Mar 17, 2022
Sold by
Rogelio Vargas
Bought by
Vargas Rogelio and Calderon Mantels
Current Estimated Value
Home Financials for this Owner
Home Financials are based on the most recent Mortgage that was taken out on this home.
Original Mortgage
$335,775
Interest Rate
4.16%
Mortgage Type
FHA
Purchase Details
Closed on
Oct 18, 2019
Sold by
Cannon Robert D
Bought by
Cannon Robert D and Cannon Leilani
Home Financials for this Owner
Home Financials are based on the most recent Mortgage that was taken out on this home.
Original Mortgage
$201,600
Interest Rate
3.4%
Mortgage Type
New Conventional
Purchase Details
Closed on
Oct 17, 2019
Sold by
Anderson Marie B and Anderson Darin S
Bought by
Cannon Robert D
Home Financials for this Owner
Home Financials are based on the most recent Mortgage that was taken out on this home.
Original Mortgage
$201,600
Interest Rate
3.4%
Mortgage Type
New Conventional
Purchase Details
Closed on
Jul 19, 2005
Sold by
Rollins Benjamin K and Rollins Brooke L
Bought by
Anderson Darin S and Anderson Marie B
Home Financials for this Owner
Home Financials are based on the most recent Mortgage that was taken out on this home.
Original Mortgage
$6,336
Interest Rate
5.51%
Mortgage Type
Stand Alone Second
Purchase Details
Closed on
Jan 30, 2001
Sold by
Mark Higley Construction Lc
Bought by
Rollins Benjamin K and Rollins Brooke L
Home Financials for this Owner
Home Financials are based on the most recent Mortgage that was taken out on this home.
Original Mortgage
$112,095
Interest Rate
7.13%
Mortgage Type
FHA
Purchase Details
Closed on
Oct 11, 2000
Sold by
Chestnut Investments Llc
Bought by
Mark Higley Construction Lc
Home Financials for this Owner
Home Financials are based on the most recent Mortgage that was taken out on this home.
Original Mortgage
$101,000
Interest Rate
7.96%
Create a Home Valuation Report for This Property
The Home Valuation Report is an in-depth analysis detailing your home's value as well as a comparison with similar homes in the area
Home Values in the Area
Average Home Value in this Area
Purchase History
| Date | Buyer | Sale Price | Title Company |
|---|---|---|---|
| Vargas Rogelio | -- | None Listed On Document | |
| Vargas Rogelio | -- | None Listed On Document | |
| Cannon Robert D | -- | Stewart Title Ins Agen | |
| Cannon Robert D | -- | Backman Title | |
| Anderson Darin S | -- | Founders Title Co | |
| Rollins Benjamin K | -- | Heritage West Title Insuranc | |
| Mark Higley Construction Lc | -- | Heritage West Title Insuranc |
Source: Public Records
Mortgage History
| Date | Status | Borrower | Loan Amount |
|---|---|---|---|
| Previous Owner | Vargas Rogelio | $335,775 | |
| Previous Owner | Cannon Robert D | $201,600 | |
| Previous Owner | Anderson Darin S | $6,336 | |
| Previous Owner | Anderson Darin S | $127,499 | |
| Previous Owner | Rollins Benjamin K | $112,095 | |
| Previous Owner | Mark Higley Construction Lc | $101,000 |
Source: Public Records
Tax History Compared to Growth
Tax History
| Year | Tax Paid | Tax Assessment Tax Assessment Total Assessment is a certain percentage of the fair market value that is determined by local assessors to be the total taxable value of land and additions on the property. | Land | Improvement |
|---|---|---|---|---|
| 2025 | $2,179 | $209,550 | $93,812 | $115,738 |
| 2024 | $2,208 | $213,400 | $102,757 | $110,643 |
| 2023 | $2,013 | $360,000 | $117,547 | $242,453 |
| 2022 | $2,146 | $212,300 | $71,130 | $141,170 |
| 2021 | $1,983 | $291,000 | $90,356 | $200,644 |
| 2020 | $1,721 | $250,000 | $77,478 | $172,522 |
| 2019 | $1,663 | $236,000 | $89,243 | $146,757 |
| 2018 | $1,528 | $213,000 | $75,210 | $137,790 |
| 2016 | $1,396 | $100,485 | $29,433 | $71,052 |
| 2015 | $1,364 | $93,335 | $29,433 | $63,902 |
| 2014 | $1,334 | $92,758 | $29,433 | $63,325 |
| 2013 | -- | $80,837 | $27,143 | $53,694 |
Source: Public Records
Map
Nearby Homes