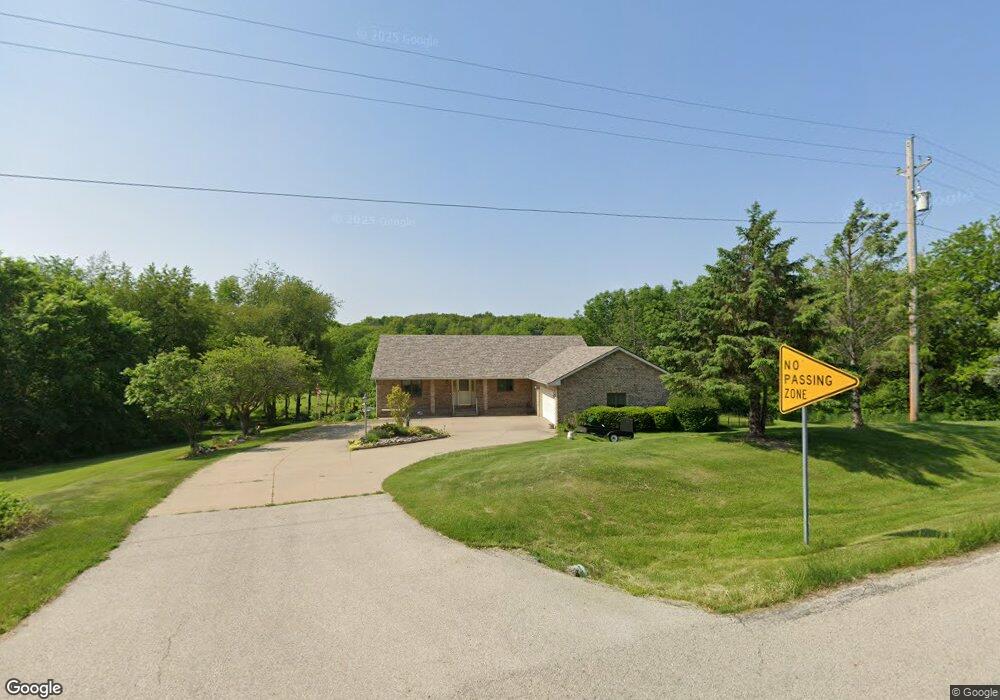
21412 71st Ave N Port Byron, IL 61275
Estimated Value: $359,000 - $453,000
2
Beds
1
Bath
1,445
Sq Ft
$273/Sq Ft
Est. Value
About This Home
This home is located at 21412 71st Ave N, Port Byron, IL 61275 and is currently estimated at $394,957, approximately $273 per square foot. 21412 71st Ave N is a home located in Rock Island County with nearby schools including Riverdale Elementary School, Riverdale Middle School, and Riverdale Senior High School.
Ownership History
Date
Name
Owned For
Owner Type
Purchase Details
Closed on
Aug 7, 2017
Sold by
Decook Thomas M
Bought by
Bobb Harold D and Bobb Donna M
Current Estimated Value
Home Financials for this Owner
Home Financials are based on the most recent Mortgage that was taken out on this home.
Original Mortgage
$194,000
Outstanding Balance
$132,558
Interest Rate
3.94%
Mortgage Type
New Conventional
Estimated Equity
$262,399
Purchase Details
Closed on
Jul 17, 2017
Sold by
Decook Thomas M
Bought by
Bobb Harold D and Bobb Donna
Home Financials for this Owner
Home Financials are based on the most recent Mortgage that was taken out on this home.
Original Mortgage
$194,000
Outstanding Balance
$132,558
Interest Rate
3.94%
Mortgage Type
New Conventional
Estimated Equity
$262,399
Create a Home Valuation Report for This Property
The Home Valuation Report is an in-depth analysis detailing your home's value as well as a comparison with similar homes in the area
Home Values in the Area
Average Home Value in this Area
Purchase History
| Date | Buyer | Sale Price | Title Company |
|---|---|---|---|
| Bobb Harold D | -- | Nash Nash Bean & Ford Llp | |
| Bobb Harold D | $294,000 | Nash Nash Bean & Ford Llp |
Source: Public Records
Mortgage History
| Date | Status | Borrower | Loan Amount |
|---|---|---|---|
| Open | Bobb Harold D | $194,000 |
Source: Public Records
Tax History Compared to Growth
Tax History
| Year | Tax Paid | Tax Assessment Tax Assessment Total Assessment is a certain percentage of the fair market value that is determined by local assessors to be the total taxable value of land and additions on the property. | Land | Improvement |
|---|---|---|---|---|
| 2024 | $7,697 | $117,917 | $8,948 | $108,969 |
| 2023 | $7,697 | $108,181 | $8,209 | $99,972 |
| 2022 | $6,794 | $102,444 | $7,774 | $94,670 |
| 2021 | $6,598 | $97,104 | $7,369 | $89,735 |
| 2020 | $6,482 | $95,481 | $7,246 | $88,235 |
| 2019 | $6,473 | $95,006 | $7,210 | $87,796 |
| 2018 | $5,829 | $88,213 | $6,299 | $81,914 |
| 2017 | $5,979 | $86,314 | $6,163 | $80,151 |
| 2016 | $2,400 | $84,209 | $6,013 | $78,196 |
| 2015 | $2,432 | $78,700 | $5,620 | $73,080 |
| 2014 | $520 | $76,039 | $5,430 | $70,609 |
| 2013 | $520 | $76,039 | $5,430 | $70,609 |
Source: Public Records
Map
Nearby Homes
- 21428 71st Ave N
- 21516 71st Ave N
- 21510 71st Ave N
- 21521 71st Ave N
- 21700 71st Ave N
- LOT 5 92nd Avenue Ct
- LOT 4 92nd Avenue Ct
- LOT 2 92nd Avenue Ct
- LOT 6 92nd Avenue Ct
- LOT 3 92nd Avenue Ct
- LOT 7 92nd Avenue Ct
- 1202 3rd Ave
- 21008 71st Ave N
- 7600 216th St N
- 3913 2290 N Street Cir N
- 7429 217th St N
- 419 Barber Creek Rd
- 7520 217th St N
- 21720 71st Ave N
- 418 Barber Creek Rd