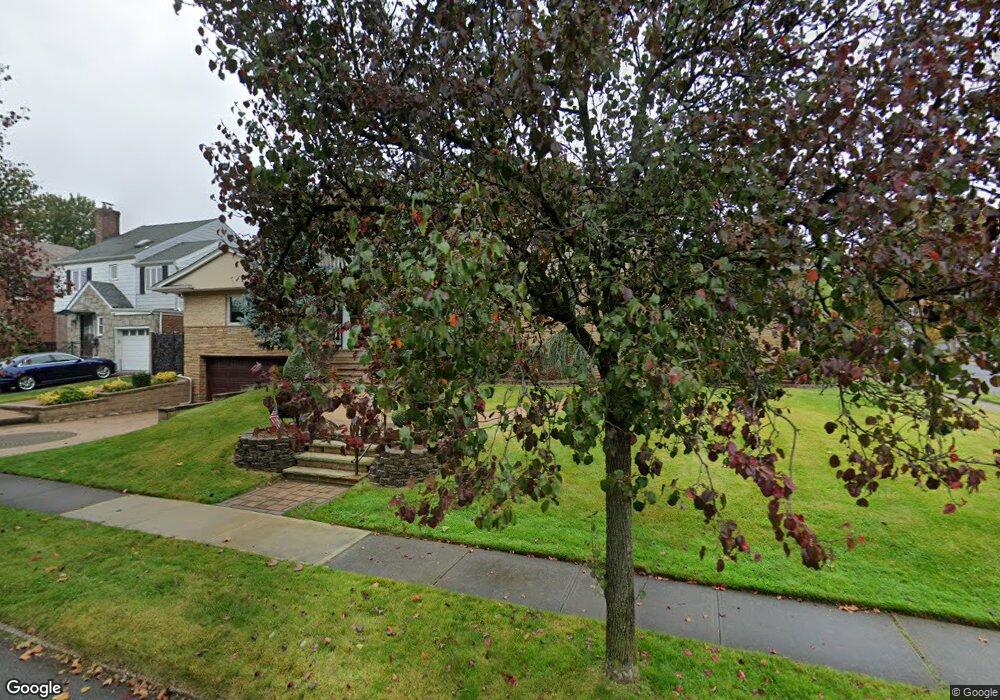
21415 86th Ave Queens Village, NY 11427
Oakland Gardens NeighborhoodEstimated Value: $1,801,000 - $2,902,000
--
Bed
--
Bath
4,711
Sq Ft
$520/Sq Ft
Est. Value
About This Home
This home is located at 21415 86th Ave, Queens Village, NY 11427 and is currently estimated at $2,450,819, approximately $520 per square foot. 21415 86th Ave is a home located in Queens County with nearby schools including P.S. 188 - Kingsbury, Irwin Altman Middle School 172, and Martin Van Buren High School.
Ownership History
Date
Name
Owned For
Owner Type
Purchase Details
Closed on
Nov 1, 2023
Sold by
Bangiyev Boris
Bought by
B.Bangiyev Idit Uta 11012023 and Boris Bangiyev As Trustee
Current Estimated Value
Purchase Details
Closed on
Nov 17, 2015
Sold by
Sherman Jagranie
Bought by
Bangiyev Boris
Home Financials for this Owner
Home Financials are based on the most recent Mortgage that was taken out on this home.
Original Mortgage
$625,500
Outstanding Balance
$491,970
Interest Rate
3.87%
Mortgage Type
Purchase Money Mortgage
Estimated Equity
$1,958,849
Purchase Details
Closed on
Feb 15, 2007
Sold by
Singh Bodwattie R and Singh Keith R
Bought by
Sherman Jagranie
Home Financials for this Owner
Home Financials are based on the most recent Mortgage that was taken out on this home.
Original Mortgage
$700,000
Interest Rate
6.27%
Mortgage Type
Purchase Money Mortgage
Purchase Details
Closed on
Sep 26, 2000
Sold by
Zwecker Efraim and Zwecker Judith
Bought by
Singh Bodwattie R and Singh Keith R
Create a Home Valuation Report for This Property
The Home Valuation Report is an in-depth analysis detailing your home's value as well as a comparison with similar homes in the area
Home Values in the Area
Average Home Value in this Area
Purchase History
| Date | Buyer | Sale Price | Title Company |
|---|---|---|---|
| B.Bangiyev Idit Uta 11012023 | -- | -- | |
| Bangiyev Boris | $1,610,000 | -- | |
| Sherman Jagranie | $1,400,000 | -- | |
| Sherman Jagranie | $1,400,000 | -- | |
| Singh Bodwattie R | -- | -- | |
| Singh Bodwattie R | -- | -- |
Source: Public Records
Mortgage History
| Date | Status | Borrower | Loan Amount |
|---|---|---|---|
| Open | Bangiyev Boris | $625,500 | |
| Previous Owner | Sherman Jagranie | $700,000 |
Source: Public Records
Tax History Compared to Growth
Tax History
| Year | Tax Paid | Tax Assessment Tax Assessment Total Assessment is a certain percentage of the fair market value that is determined by local assessors to be the total taxable value of land and additions on the property. | Land | Improvement |
|---|---|---|---|---|
| 2025 | $21,562 | $109,814 | $36,342 | $73,472 |
| 2024 | $21,562 | $107,352 | $33,369 | $73,983 |
| 2023 | $20,341 | $101,276 | $26,690 | $74,586 |
| 2022 | $18,045 | $131,760 | $41,460 | $90,300 |
| 2021 | $20,107 | $131,100 | $41,460 | $89,640 |
| 2020 | $19,370 | $115,920 | $41,460 | $74,460 |
| 2019 | $18,714 | $127,680 | $41,460 | $86,220 |
| 2018 | $17,204 | $84,397 | $38,191 | $46,206 |
| 2017 | $16,231 | $79,620 | $41,460 | $38,160 |
| 2016 | $16,160 | $79,620 | $41,460 | $38,160 |
| 2015 | $10,303 | $76,260 | $46,080 | $30,180 |
| 2014 | $10,303 | $76,260 | $46,080 | $30,180 |
Source: Public Records
Map
Nearby Homes
- 214-23 86th Rd
- 8519 212th St
- 82-43 213th St
- 8210 214th St
- 212-52 Whitehall Terrace
- 214- 37 Hillside Ave Unit B
- 214-32 Hillside Ave
- 213-14 Hillside Ave
- 219-44 Peck Ave
- 8818 215th Place
- 88-20 215th St
- 217-30 Peck Ave
- 218-27 Sawyer Ave
- 215 E 89th St Unit 2B
- 88-49 212th Place
- 21837 Spencer Ave
- 89-09 215th St
- 8821 Hollis Court Blvd
- 89-16 214th St
- 80-54 210th St