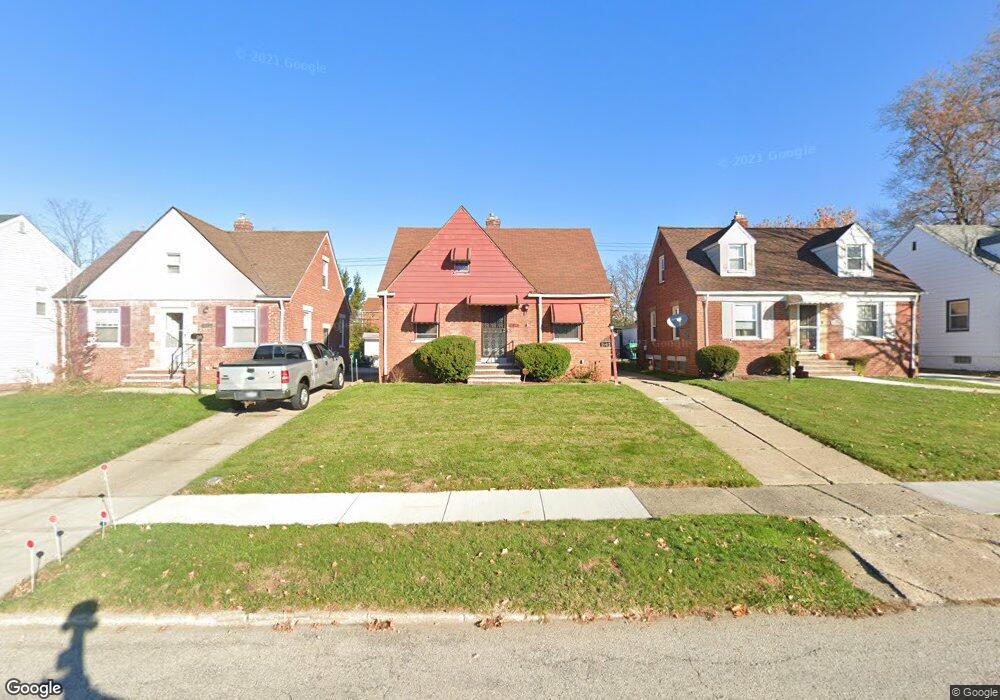
21415 Clare Ave Maple Heights, OH 44137
Estimated Value: $106,000 - $127,000
3
Beds
1
Bath
1,175
Sq Ft
$100/Sq Ft
Est. Value
About This Home
This home is located at 21415 Clare Ave, Maple Heights, OH 44137 and is currently estimated at $117,025, approximately $99 per square foot. 21415 Clare Ave is a home located in Cuyahoga County with nearby schools including Abraham Lincoln Elementary School, Rockside/ J.F. Kennedy School, and Barack Obama School.
Ownership History
Date
Name
Owned For
Owner Type
Purchase Details
Closed on
Mar 27, 2024
Sold by
Byrd Ronald D
Bought by
Byrd Leshanna R
Current Estimated Value
Purchase Details
Closed on
Mar 26, 1998
Sold by
Graham Gregory S
Bought by
Byrd Ronald and Byrd Vivian
Home Financials for this Owner
Home Financials are based on the most recent Mortgage that was taken out on this home.
Original Mortgage
$67,200
Interest Rate
10.74%
Purchase Details
Closed on
Feb 11, 1987
Sold by
Allendorf Carl H
Bought by
Graham Gregory S
Purchase Details
Closed on
Jul 25, 1979
Sold by
Deltorto James
Bought by
Allendorf Carl H
Purchase Details
Closed on
Nov 8, 1978
Sold by
Skoll William
Bought by
Deltorto James
Purchase Details
Closed on
Feb 18, 1977
Sold by
Skoll Mary
Bought by
Skoll William
Purchase Details
Closed on
Jan 1, 1975
Bought by
Skoll Mary
Create a Home Valuation Report for This Property
The Home Valuation Report is an in-depth analysis detailing your home's value as well as a comparison with similar homes in the area
Home Values in the Area
Average Home Value in this Area
Purchase History
We collect this data history from publicly available records. To have your information removed, we recommend requesting removal directly through your county’s website.
| Date | Buyer | Sale Price | Title Company |
|---|---|---|---|
| Byrd Leshanna R | -- | None Listed On Document | |
| Byrd Ronald | $66,000 | Tower City Title Agency Inc | |
| Graham Gregory S | $45,000 | -- | |
| Allendorf Carl H | $44,000 | -- | |
| Deltorto James | $36,000 | -- | |
| Skoll William | -- | -- | |
| Skoll Mary | -- | -- |
Source: Public Records
Mortgage History
We collect this data history from publicly available records. To have your information removed, we recommend requesting removal directly through your county’s website.
| Date | Status | Borrower | Loan Amount |
|---|---|---|---|
| Previous Owner | Byrd Ronald | $67,200 |
Source: Public Records
Tax History
| Year | Tax Paid | Tax Assessment Tax Assessment Total Assessment is a certain percentage of the fair market value that is determined by local assessors to be the total taxable value of land and additions on the property. | Land | Improvement |
|---|---|---|---|---|
| 2025 | $2,547 | $31,535 | $6,720 | $24,815 |
| 2024 | $1,995 | $31,535 | $6,720 | $24,815 |
| 2023 | $1,173 | $19,360 | $4,060 | $15,300 |
| 2022 | $1,207 | $19,360 | $4,060 | $15,300 |
| 2021 | $1,281 | $19,360 | $4,060 | $15,300 |
| 2020 | $881 | $14,670 | $3,080 | $11,590 |
| 2019 | $871 | $41,900 | $8,800 | $33,100 |
| 2018 | $763 | $14,670 | $3,080 | $11,590 |
| 2017 | $725 | $13,270 | $2,870 | $10,400 |
| 2016 | $697 | $13,270 | $2,870 | $10,400 |
| 2015 | $8,551 | $13,270 | $2,870 | $10,400 |
| 2014 | $8,551 | $14,600 | $3,150 | $11,450 |
Source: Public Records
Map
Nearby Homes
- 21860 Louis Rd
- 21202 Hillgrove Ave
- 21506 Kenyon Dr
- 21104 Clare Ave
- 21202 Gardenview Dr
- 5147 Warrensville Center Rd
- 20514 Mountville Dr
- 20503 Mountville Dr
- 0 Miles Rd Unit 5188561
- 5319 Fairtree Rd
- 20111 Mountville Dr
- 5411 Mardale Ave
- 19910 Mountville Dr
- 19703 Fairway Ave
- 4914 Green Rd
- 20648 Donny Brook Rd
- 19812 Marvin Rd
- 19313 Longview Ave
- 5437 Bartlett Rd
- 19280 Stafford Ave
- 21515 Hillgrove Ave
- 21603 Hillgrove Ave
- 21511 Hillgrove Ave
- 21607 Hillgrove Ave
- 21503 Hillgrove Ave
- 21611 Hillgrove Ave
- 21506 Franklin Rd
- 21508 Franklin Rd
- 21504 Franklin Rd
- 21419 Hillgrove Ave
- 21502 Franklin Rd
- 21602 Franklin Rd
- 21512 Hillgrove Ave
- 21602 Hillgrove Ave
- 21510 Hillgrove Ave
- 21606 Hillgrove Ave
- 21506 Hillgrove Ave
- 21415 Hillgrove Ave
- 21500 Franklin Rd
- 21502 Hillgrove Ave
Your Personal Tour Guide
Ask me questions while you tour the home.