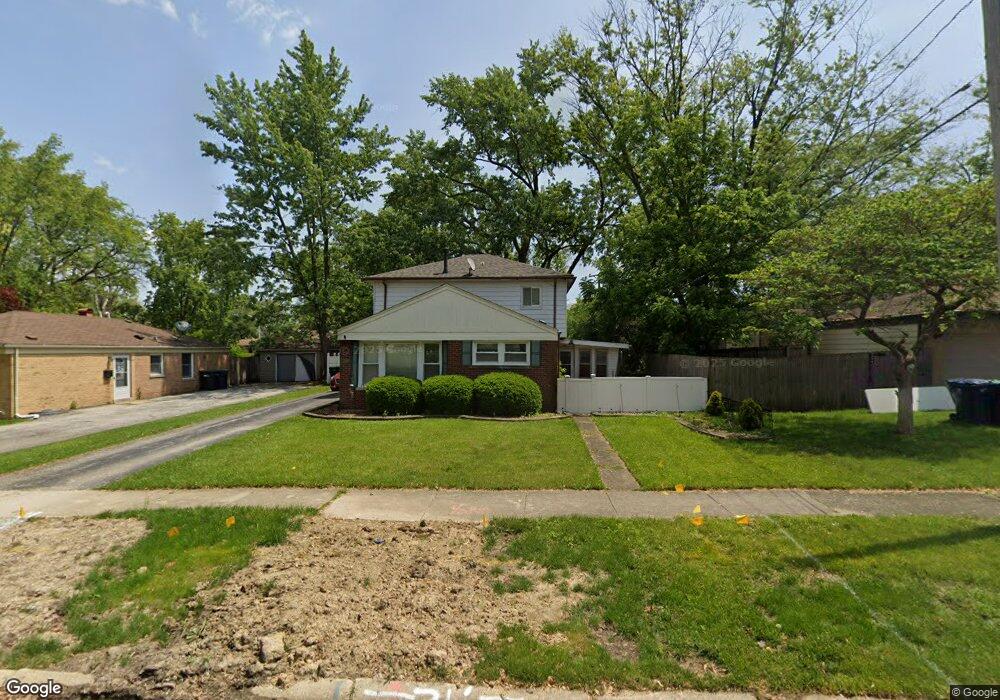
21417 S Quinn Ave Matteson, IL 60443
Old Matteson NeighborhoodEstimated Value: $209,000 - $235,000
4
Beds
1
Bath
1,782
Sq Ft
$124/Sq Ft
Est. Value
About This Home
This home is located at 21417 S Quinn Ave, Matteson, IL 60443 and is currently estimated at $220,767, approximately $123 per square foot. 21417 S Quinn Ave is a home located in Cook County with nearby schools including Illinois School, Matteson Elementary School, and Sauk Elementary School.
Ownership History
Date
Name
Owned For
Owner Type
Purchase Details
Closed on
Apr 20, 2006
Sold by
Harlston Kelli and Harlston Eric M
Bought by
Harlston Eric M and Harlston Kellie
Current Estimated Value
Home Financials for this Owner
Home Financials are based on the most recent Mortgage that was taken out on this home.
Original Mortgage
$167,401
Outstanding Balance
$96,532
Interest Rate
6.42%
Mortgage Type
FHA
Estimated Equity
$124,235
Purchase Details
Closed on
Nov 29, 2005
Sold by
Groark Richard E and Groark Margaret A
Bought by
Harlston Eric M and Harlston Kelli
Home Financials for this Owner
Home Financials are based on the most recent Mortgage that was taken out on this home.
Original Mortgage
$162,352
Interest Rate
6.36%
Mortgage Type
FHA
Purchase Details
Closed on
Dec 6, 1993
Sold by
Kane Ellen J
Bought by
Groark Richard E and Groark Margaret A
Home Financials for this Owner
Home Financials are based on the most recent Mortgage that was taken out on this home.
Original Mortgage
$75,200
Interest Rate
7.15%
Create a Home Valuation Report for This Property
The Home Valuation Report is an in-depth analysis detailing your home's value as well as a comparison with similar homes in the area
Home Values in the Area
Average Home Value in this Area
Purchase History
| Date | Buyer | Sale Price | Title Company |
|---|---|---|---|
| Harlston Eric M | -- | Oconnor Title Services Inc | |
| Harlston Eric M | $170,000 | Atgf Inc | |
| Groark Richard E | $63,333 | -- |
Source: Public Records
Mortgage History
| Date | Status | Borrower | Loan Amount |
|---|---|---|---|
| Open | Harlston Eric M | $167,401 | |
| Closed | Harlston Eric M | $162,352 | |
| Previous Owner | Groark Richard E | $75,200 |
Source: Public Records
Tax History Compared to Growth
Tax History
| Year | Tax Paid | Tax Assessment Tax Assessment Total Assessment is a certain percentage of the fair market value that is determined by local assessors to be the total taxable value of land and additions on the property. | Land | Improvement |
|---|---|---|---|---|
| 2024 | $6,069 | $18,000 | $3,000 | $15,000 |
| 2023 | $3,692 | $18,000 | $3,000 | $15,000 |
| 2022 | $3,692 | $10,226 | $2,625 | $7,601 |
| 2021 | $3,792 | $10,226 | $2,625 | $7,601 |
| 2020 | $3,628 | $10,226 | $2,625 | $7,601 |
| 2019 | $4,546 | $12,212 | $2,437 | $9,775 |
| 2018 | $4,542 | $12,212 | $2,437 | $9,775 |
| 2017 | $4,390 | $12,212 | $2,437 | $9,775 |
| 2016 | $4,374 | $11,393 | $2,250 | $9,143 |
| 2015 | $4,275 | $11,393 | $2,250 | $9,143 |
| 2014 | $4,167 | $11,393 | $2,250 | $9,143 |
| 2013 | $4,263 | $12,507 | $2,250 | $10,257 |
Source: Public Records
Map
Nearby Homes
- 3809 215th St
- 3865 216th St
- 3727 214th Place Unit 2
- 3712 214th St
- 3711 213th Place
- 3704 215th St Unit 205
- 3817 216th Place
- 3638 213th St
- 21142 Locust St
- 4200 Washington Ave
- 3718 211th Place
- 3533 212th Place
- 21607 Main St
- 21209 Oak St
- 21829 Richton Rd
- 3422 Station Dr
- 21835 1/2 Richton Rd
- 21130 Kildare Ave
- 549 Homan Ave
- 242 Hickory St
- 21413 S Quinn Ave
- 3830 214th Place
- 21421 S Quinn Ave
- 3823 214th St
- 21412 Butterfield Pkwy
- 3824 214th Place
- 3820 214th Place
- 3819 214th St
- 21416 S Quinn Ave
- 21410 S Quinn Ave
- 21420 S Quinn Ave
- 21408 S Quinn Ave Unit 1
- 3844 214th Place
- 3816 214th Place
- 3813 214th St Unit 1
- 21406 S Quinn Ave
- 3827 214th Place
- 3833 214th Place
- 3810 214th Place
- 3823 214th Place