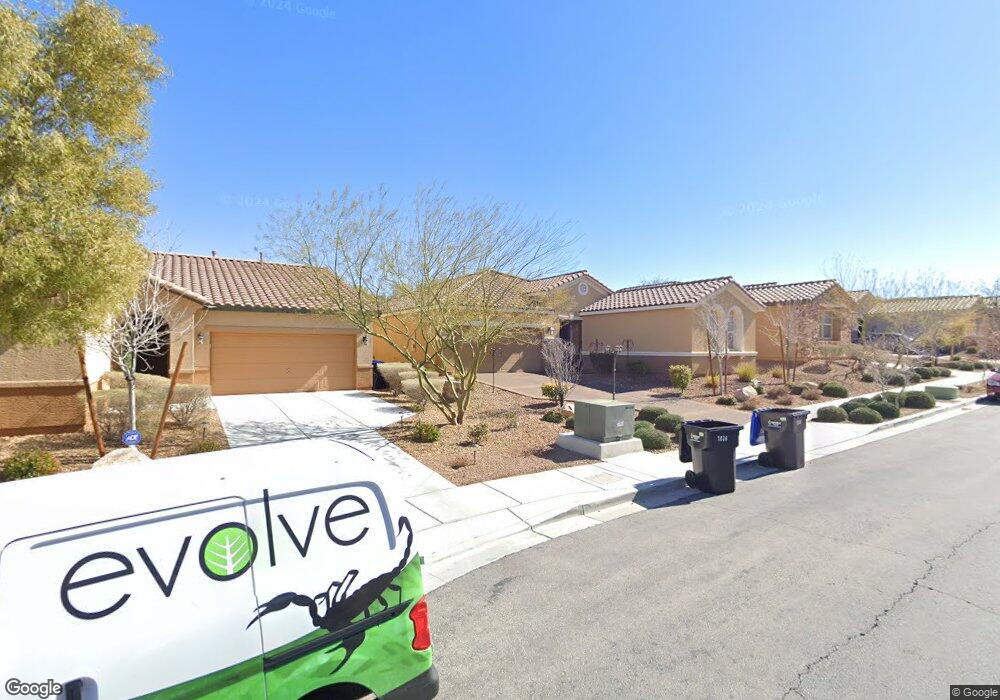
2142 Cedar Valley Ct Unit 17 Henderson, NV 89052
Sun City Anthem NeighborhoodEstimated Value: $491,263 - $559,000
2
Beds
2
Baths
1,569
Sq Ft
$329/Sq Ft
Est. Value
About This Home
This home is located at 2142 Cedar Valley Ct Unit 17, Henderson, NV 89052 and is currently estimated at $516,816, approximately $329 per square foot. 2142 Cedar Valley Ct Unit 17 is a home located in Clark County with nearby schools including Shirley & Bill Wallin Elementary School, Del E. Webb Middle School, and Liberty High School.
Ownership History
Date
Name
Owned For
Owner Type
Purchase Details
Closed on
Nov 16, 2021
Sold by
Maglalang Mario and Maglalang Maria
Bought by
Maglalang Mario and Maglalang Maria
Current Estimated Value
Home Financials for this Owner
Home Financials are based on the most recent Mortgage that was taken out on this home.
Original Mortgage
$311,645
Outstanding Balance
$285,806
Interest Rate
3.05%
Mortgage Type
New Conventional
Estimated Equity
$231,010
Purchase Details
Closed on
Apr 25, 2020
Sold by
Maglalang Mario and Maglalang Maria
Bought by
Mario And Maria Maglalang Living Revocable Tr and Maglalang
Home Financials for this Owner
Home Financials are based on the most recent Mortgage that was taken out on this home.
Original Mortgage
$267,021
Interest Rate
2.9%
Mortgage Type
New Conventional
Purchase Details
Closed on
Oct 19, 2018
Sold by
Maglalang Mario and Maglalang Maria
Bought by
Maglalang Mario and Maglalang Maria
Home Financials for this Owner
Home Financials are based on the most recent Mortgage that was taken out on this home.
Original Mortgage
$269,637
Interest Rate
3.99%
Mortgage Type
FHA
Purchase Details
Closed on
Oct 7, 2015
Sold by
Maglalang Mario and Maglalang Maria
Bought by
Mario And Maria Maglalang Living Revocab
Home Financials for this Owner
Home Financials are based on the most recent Mortgage that was taken out on this home.
Original Mortgage
$223,600
Interest Rate
3.86%
Mortgage Type
New Conventional
Purchase Details
Closed on
Jun 2, 2014
Sold by
Maglalang Mario and Maglalang Maria
Bought by
Maglalang Mario and Maglalang Maria
Purchase Details
Closed on
Jan 15, 2008
Sold by
The Mario & Maria Maglalang Living Trust
Bought by
Maglalang Maria and Maglalang Mario
Home Financials for this Owner
Home Financials are based on the most recent Mortgage that was taken out on this home.
Original Mortgage
$244,000
Interest Rate
6.07%
Mortgage Type
New Conventional
Purchase Details
Closed on
Sep 1, 2005
Sold by
Maglalang Mario and Maglalang Maria Luisa
Bought by
Maglalang Mario and Maglalang Maria
Purchase Details
Closed on
Jul 7, 2003
Sold by
Del Webb Communities Inc
Bought by
Maglalang Mario and Maglalang Maria Luisa
Home Financials for this Owner
Home Financials are based on the most recent Mortgage that was taken out on this home.
Original Mortgage
$181,000
Interest Rate
5.22%
Mortgage Type
Unknown
Create a Home Valuation Report for This Property
The Home Valuation Report is an in-depth analysis detailing your home's value as well as a comparison with similar homes in the area
Home Values in the Area
Average Home Value in this Area
Purchase History
| Date | Buyer | Sale Price | Title Company |
|---|---|---|---|
| Maglalang Mario | -- | Amrock Llc | |
| Maglalang Mario | -- | Amrock Llc | |
| Mario And Maria Maglalang Living Revocable Tr | -- | None Listed On Document | |
| Maglalang Mario | -- | Amrock Llc | |
| Maglalang Mario | -- | Amrock Inc | |
| Maglalang Mario | -- | Amrock Inc | |
| Mario And Maria Maglalang Living Revocab | -- | Title Source Inc | |
| Maglalang Mario | -- | Title Source Inc | |
| Maglalang Mario | -- | None Available | |
| Maglalang Maria | -- | Fidelity National Title | |
| Maglalang Mario | -- | None Available | |
| Maglalang Mario | $203,788 | Lawyers Title Of Nevada |
Source: Public Records
Mortgage History
| Date | Status | Borrower | Loan Amount |
|---|---|---|---|
| Open | Maglalang Mario | $311,645 | |
| Previous Owner | Maglalang Mario | $267,021 | |
| Previous Owner | Maglalang Mario | $269,637 | |
| Previous Owner | Mario And Maria Maglalang Living Revocab | $223,600 | |
| Previous Owner | Maglalang Maria | $244,000 | |
| Previous Owner | Maglalang Mario | $181,000 |
Source: Public Records
Tax History Compared to Growth
Tax History
| Year | Tax Paid | Tax Assessment Tax Assessment Total Assessment is a certain percentage of the fair market value that is determined by local assessors to be the total taxable value of land and additions on the property. | Land | Improvement |
|---|---|---|---|---|
| 2025 | $2,462 | $126,196 | $54,600 | $71,596 |
| 2024 | $2,391 | $126,196 | $54,600 | $71,596 |
| 2023 | $1,830 | $109,292 | $41,580 | $67,712 |
| 2022 | $2,322 | $96,415 | $34,650 | $61,765 |
| 2021 | $2,357 | $87,445 | $28,875 | $58,570 |
| 2020 | $2,185 | $86,341 | $28,490 | $57,851 |
| 2019 | $2,048 | $84,132 | $26,950 | $57,182 |
| 2018 | $1,954 | $80,104 | $25,025 | $55,079 |
| 2017 | $2,286 | $77,926 | $23,100 | $54,826 |
| 2016 | $1,830 | $70,577 | $17,325 | $53,252 |
| 2015 | $1,776 | $64,062 | $11,550 | $52,512 |
| 2014 | $1,721 | $60,088 | $7,700 | $52,388 |
Source: Public Records
Map
Nearby Homes
- 2167 Maple Heights Ct
- 2076 Rockburne St
- 2101 Canvas Edge Dr
- 3165 Via Como
- 3048 Brownbirds Nest Dr
- 3158 Teaderman Walk
- 3065 Hartsville Rd
- 3175 Obscured Light Walk
- 3029 Brownbirds Nest Dr Unit 17
- 1936 Via Firenze
- 2125 Emyvale Ct
- 1932 Via Firenze
- 3052 Hartsville Rd
- 3175 Via Seranova
- 2084 Airy Petals Walk
- 2110 Waterlily View St
- 2084 Fort Halifax St
- 1966 Via Delle Arti
- 2002 Wildwood Lake St
- 2077 Wildwood Lake St
- 2138 Cedar Valley Ct
- 2134 Cedar Valley Ct
- 2143 Treasure Lake Ct
- 2044 Canvas Edge Dr
- 2139 Treasure Lake Ct
- 2048 Canvas Edge Dr
- 2147 Treasure Lake Ct Unit 17
- 2130 Cedar Valley Ct
- 2135 Treasure Lake Ct Unit 17
- 2040 Canvas Edge Dr
- 2052 Canvas Edge Dr
- 2036 Canvas Edge Dr
- 2131 Treasure Lake Ct
- 2032 Canvas Edge Dr
- 2056 Canvas Edge Dr
- 2137 Cedar Valley Ct
- 2151 Treasure Lake Ct
- 2028 Canvas Edge Dr
- 2133 Cedar Valley Ct
- 2060 Canvas Edge Dr