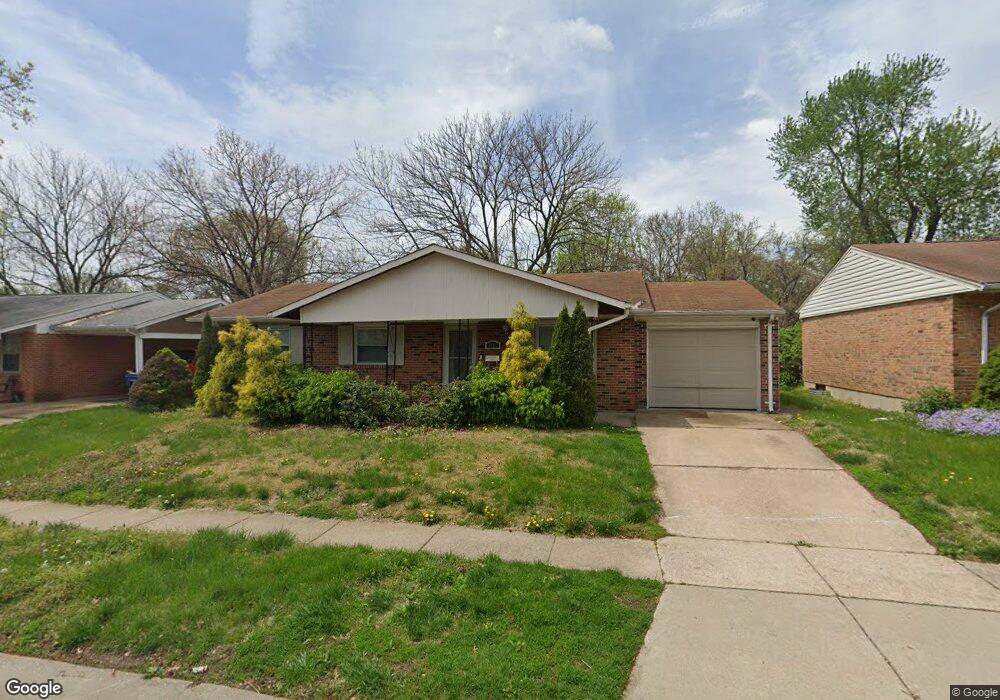
2142 Central Pkwy Florissant, MO 63031
Estimated Value: $181,000 - $186,000
3
Beds
2
Baths
1,189
Sq Ft
$155/Sq Ft
Est. Value
About This Home
This home is located at 2142 Central Pkwy, Florissant, MO 63031 and is currently estimated at $184,257, approximately $154 per square foot. 2142 Central Pkwy is a home located in St. Louis County with nearby schools including Walker Elementary School, Northwest Middle School, and Hazelwood West High School.
Ownership History
Date
Name
Owned For
Owner Type
Purchase Details
Closed on
Apr 17, 2025
Sold by
Muange Irene N and Katungi Justus Muange
Bought by
Comcare Medical Transportation Llc
Current Estimated Value
Home Financials for this Owner
Home Financials are based on the most recent Mortgage that was taken out on this home.
Original Mortgage
$122,500
Outstanding Balance
$121,954
Interest Rate
6.63%
Mortgage Type
New Conventional
Estimated Equity
$62,303
Purchase Details
Closed on
Sep 9, 2013
Sold by
Sumner Capital Group Lp
Bought by
Muange Iree N and Katungi Justus Muange
Home Financials for this Owner
Home Financials are based on the most recent Mortgage that was taken out on this home.
Original Mortgage
$83,460
Interest Rate
4.12%
Mortgage Type
FHA
Purchase Details
Closed on
Nov 14, 2012
Sold by
Estate Of George W Sommers
Bought by
Sumner Capital Group Lp
Create a Home Valuation Report for This Property
The Home Valuation Report is an in-depth analysis detailing your home's value as well as a comparison with similar homes in the area
Home Values in the Area
Average Home Value in this Area
Purchase History
| Date | Buyer | Sale Price | Title Company |
|---|---|---|---|
| Comcare Medical Transportation Llc | -- | Clear Title Services | |
| Muange Iree N | $85,000 | Us Title Main | |
| Sumner Capital Group Lp | $50,000 | Ctc |
Source: Public Records
Mortgage History
| Date | Status | Borrower | Loan Amount |
|---|---|---|---|
| Open | Comcare Medical Transportation Llc | $122,500 | |
| Previous Owner | Muange Iree N | $83,460 |
Source: Public Records
Tax History Compared to Growth
Tax History
| Year | Tax Paid | Tax Assessment Tax Assessment Total Assessment is a certain percentage of the fair market value that is determined by local assessors to be the total taxable value of land and additions on the property. | Land | Improvement |
|---|---|---|---|---|
| 2025 | $2,442 | $30,760 | $5,320 | $25,440 |
| 2024 | $2,442 | $27,910 | $3,060 | $24,850 |
| 2023 | $2,442 | $27,910 | $3,060 | $24,850 |
| 2022 | $2,182 | $22,230 | $3,500 | $18,730 |
| 2021 | $2,151 | $22,230 | $3,500 | $18,730 |
| 2020 | $1,819 | $17,470 | $3,500 | $13,970 |
| 2019 | $1,792 | $17,470 | $3,500 | $13,970 |
| 2018 | $1,669 | $14,950 | $2,410 | $12,540 |
| 2017 | $1,667 | $14,950 | $2,410 | $12,540 |
| 2016 | $1,704 | $15,080 | $2,790 | $12,290 |
| 2015 | $1,668 | $15,080 | $2,790 | $12,290 |
| 2014 | $1,812 | $16,910 | $3,500 | $13,410 |
Source: Public Records
Map
Nearby Homes
- 2618 Freemantle Dr
- 2106 Kingsford Dr
- 2235 Central Parkway Dr
- 2314 Stoney End Ct
- 2042 Farflung Dr
- 2347 Farflung Dr
- 2112 Millvalley Dr
- 2390 Wharton Ct
- 2437 Periwinkle Ct
- 1834 Night Dr
- 1885 High Sun Dr
- 1907 High Sun Dr
- 2216 Foggy Bottom Dr
- 1920 High Sun Dr
- 1863 High Sun Dr Unit 51863
- 2112 New Sun Dr
- 1831 New Sun Ct Unit 5
- 1830 New Sun Ct
- 1920 Shackelford Rd
- 2048 New Sun Dr
- 2152 Central Pkwy
- 2132 Central Pkwy
- 2162 Central Pkwy
- 2122 Central Pkwy
- 2552 Auburnhill Ct
- 2141 Central Pkwy
- 2151 Central Pkwy
- 2172 Central Pkwy
- 2112 Central Pkwy
- 2562 Auburnhill Ct
- 2131 Central Pkwy
- 2161 Central Pkwy
- 2512 Auburnhill Ct
- 2121 Central Pkwy
- 2171 Central Pkwy
- 2572 Auburnhill Ct
- 2182 Central Pkwy
- 2013 Kingsford Dr
- 2111 Central Pkwy
- 2181 Central Pkwy