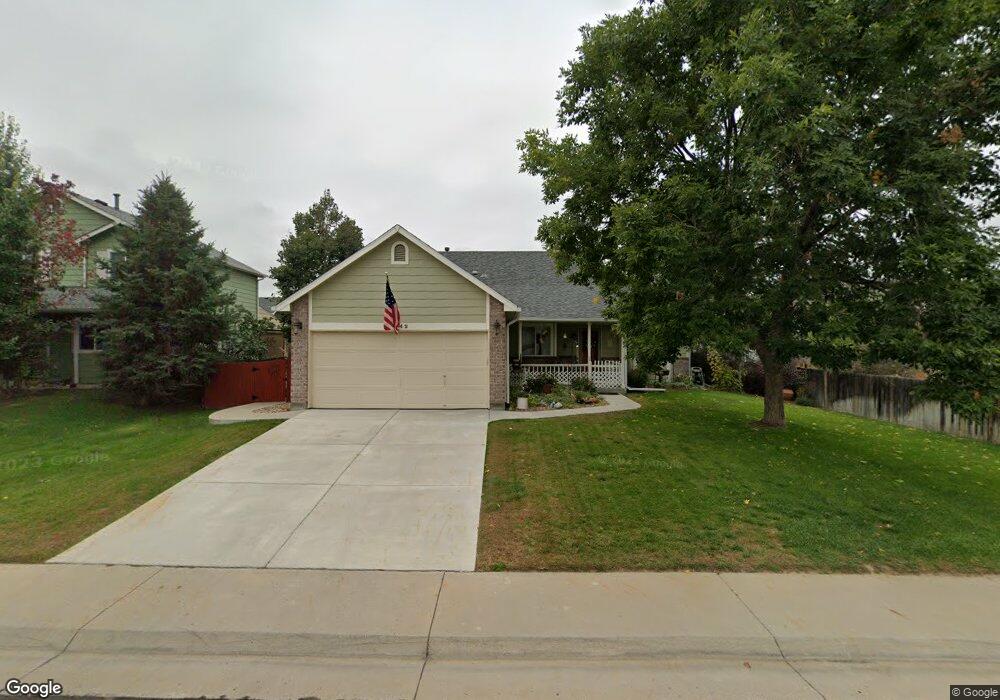
2142 Cherry St Brighton, CO 80601
Estimated Value: $464,399 - $485,000
3
Beds
2
Baths
1,407
Sq Ft
$337/Sq Ft
Est. Value
About This Home
This home is located at 2142 Cherry St, Brighton, CO 80601 and is currently estimated at $474,600, approximately $337 per square foot. 2142 Cherry St is a home located in Adams County with nearby schools including Southeast Elementary School, Vikan Middle School, and Brighton High School.
Ownership History
Date
Name
Owned For
Owner Type
Purchase Details
Closed on
May 25, 2000
Sold by
And Thorne Wayne Robert and And Analie Thorne
Bought by
Henderson Charles E and Vela Margarete A
Current Estimated Value
Home Financials for this Owner
Home Financials are based on the most recent Mortgage that was taken out on this home.
Original Mortgage
$167,400
Outstanding Balance
$58,636
Interest Rate
8.13%
Estimated Equity
$415,964
Purchase Details
Closed on
Aug 8, 1996
Sold by
Associates Relocation Management Co Inc
Bought by
Thorne Wayne Robert and Thorne Michelle Analie
Home Financials for this Owner
Home Financials are based on the most recent Mortgage that was taken out on this home.
Original Mortgage
$35,000
Interest Rate
8.15%
Purchase Details
Closed on
Jul 21, 1995
Sold by
Melody Homes Inc
Bought by
Hobbs Dan L and Hobbs Shannon L
Home Financials for this Owner
Home Financials are based on the most recent Mortgage that was taken out on this home.
Original Mortgage
$112,550
Interest Rate
7.49%
Create a Home Valuation Report for This Property
The Home Valuation Report is an in-depth analysis detailing your home's value as well as a comparison with similar homes in the area
Home Values in the Area
Average Home Value in this Area
Purchase History
| Date | Buyer | Sale Price | Title Company |
|---|---|---|---|
| Henderson Charles E | $186,400 | -- | |
| Thorne Wayne Robert | $137,000 | -- | |
| Associates Relocation Management Co Inc | -- | -- | |
| Hobbs Dan L | $125,065 | Land Title |
Source: Public Records
Mortgage History
| Date | Status | Borrower | Loan Amount |
|---|---|---|---|
| Open | Henderson Charles E | $167,400 | |
| Previous Owner | Thorne Wayne Robert | $35,000 | |
| Previous Owner | Hobbs Dan L | $112,550 |
Source: Public Records
Tax History Compared to Growth
Tax History
| Year | Tax Paid | Tax Assessment Tax Assessment Total Assessment is a certain percentage of the fair market value that is determined by local assessors to be the total taxable value of land and additions on the property. | Land | Improvement |
|---|---|---|---|---|
| 2024 | $2,575 | $28,820 | $6,130 | $22,690 |
| 2023 | $2,561 | $33,560 | $6,430 | $27,130 |
| 2022 | $1,847 | $24,650 | $6,120 | $18,530 |
| 2021 | $1,847 | $24,650 | $6,120 | $18,530 |
| 2020 | $1,685 | $24,010 | $6,290 | $17,720 |
| 2019 | $1,688 | $24,010 | $6,290 | $17,720 |
| 2018 | $1,166 | $18,810 | $6,120 | $12,690 |
| 2017 | $1,168 | $18,810 | $6,120 | $12,690 |
| 2016 | $903 | $16,890 | $3,500 | $13,390 |
| 2015 | $897 | $8,930 | $1,850 | $7,080 |
| 2014 | $646 | $6,500 | $1,430 | $5,070 |
Source: Public Records
Map
Nearby Homes
- 791 S 21st Ct
- 2364 Cherry St
- 2277 Wingler Place
- 2411 Cherry Cir
- 595 Badger Creek Dr
- 551 Longhurst Place
- 2084 Donna Ct
- 628 S 16th Ave
- 465 S 24th Ave
- 2900 Purcell St Unit 6
- 2900 Purcell St Unit I-3
- 2900 Purcell St Unit D-1
- 406 S 16th Ave
- 434 Voiles Dr
- 316 S 22nd Ave
- 290 S 22nd Ave
- 319 S 25th Ave
- 321 S 26th Ave
- 253 S 25th Ave
- 792 S 12th Ave