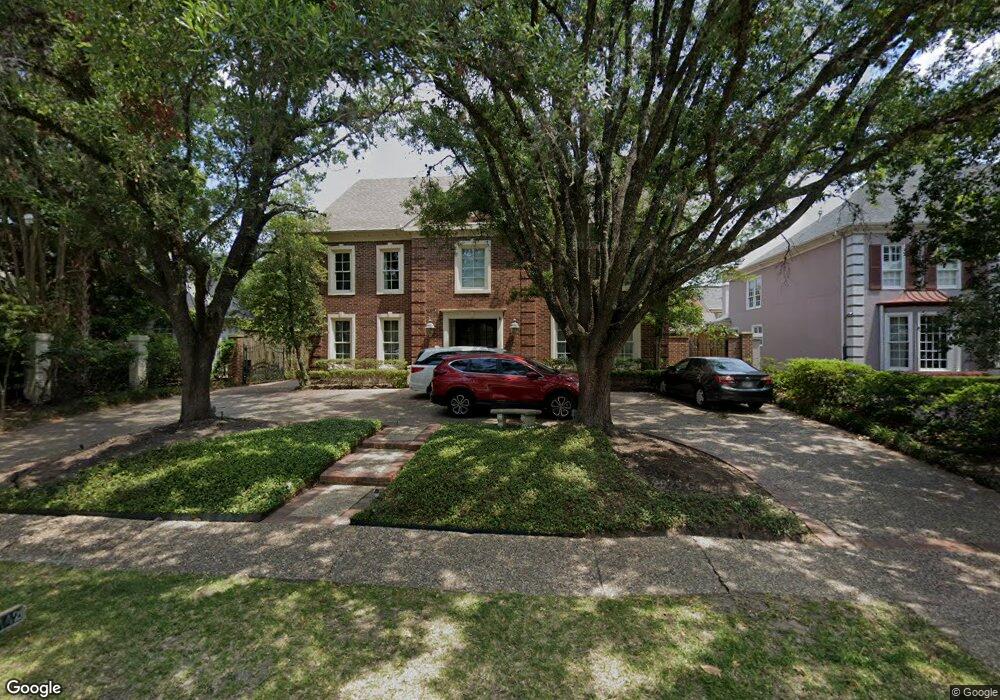
2142 Inwood Dr Houston, TX 77019
River Oaks NeighborhoodEstimated Value: $3,704,893 - $4,895,000
5
Beds
6
Baths
5,387
Sq Ft
$828/Sq Ft
Est. Value
About This Home
This home is located at 2142 Inwood Dr, Houston, TX 77019 and is currently estimated at $4,461,631, approximately $828 per square foot. 2142 Inwood Dr is a home located in Harris County with nearby schools including River Oaks Elementary School, Lanier Middle School, and Lamar High School.
Ownership History
Date
Name
Owned For
Owner Type
Purchase Details
Closed on
Apr 9, 2013
Sold by
Getten Thomas F and Getten Nancy H
Bought by
Shankar Ananth Subramonian
Current Estimated Value
Purchase Details
Closed on
Dec 28, 2006
Sold by
Ferrell James and Ferrell Elizabeth
Bought by
Getten Thomas F and Getten Nancy H
Home Financials for this Owner
Home Financials are based on the most recent Mortgage that was taken out on this home.
Original Mortgage
$400,000
Interest Rate
6.2%
Mortgage Type
Purchase Money Mortgage
Purchase Details
Closed on
Nov 6, 1997
Sold by
Ferrell James E
Bought by
Ferrell Elizabeth J
Purchase Details
Closed on
Jan 30, 1997
Sold by
Smith Stacy A
Bought by
Ferrell James E
Purchase Details
Closed on
Mar 24, 1994
Sold by
Stillwell Gary R and Stillwell Kathy I
Bought by
Ferrell James E and Ferrell Elizabeth J
Home Financials for this Owner
Home Financials are based on the most recent Mortgage that was taken out on this home.
Original Mortgage
$591,500
Interest Rate
7.05%
Create a Home Valuation Report for This Property
The Home Valuation Report is an in-depth analysis detailing your home's value as well as a comparison with similar homes in the area
Home Values in the Area
Average Home Value in this Area
Purchase History
| Date | Buyer | Sale Price | Title Company |
|---|---|---|---|
| Shankar Ananth Subramonian | -- | Charter Title Co | |
| Getten Thomas F | -- | None Available | |
| Ferrell Elizabeth J | -- | -- | |
| Ferrell James E | -- | Stewart Title Company | |
| Ferrell James E | -- | Stewart Title Company |
Source: Public Records
Mortgage History
| Date | Status | Borrower | Loan Amount |
|---|---|---|---|
| Previous Owner | Getten Thomas F | $400,000 | |
| Previous Owner | Ferrell James E | $591,500 |
Source: Public Records
Tax History Compared to Growth
Tax History
| Year | Tax Paid | Tax Assessment Tax Assessment Total Assessment is a certain percentage of the fair market value that is determined by local assessors to be the total taxable value of land and additions on the property. | Land | Improvement |
|---|---|---|---|---|
| 2025 | $62,750 | $4,656,690 | $1,822,095 | $2,834,595 |
| 2024 | $62,750 | $4,343,551 | $1,711,665 | $2,631,886 |
| 2023 | $62,750 | $3,449,154 | $1,656,450 | $1,792,704 |
| 2022 | $77,039 | $3,498,749 | $1,601,235 | $1,897,514 |
| 2021 | $83,146 | $3,567,499 | $1,490,805 | $2,076,694 |
| 2020 | $53,442 | $2,206,913 | $1,490,805 | $716,108 |
| 2019 | $55,719 | $2,201,929 | $1,490,805 | $711,124 |
| 2018 | $53,317 | $2,107,019 | $1,435,590 | $671,429 |
| 2017 | $53,277 | $2,107,019 | $1,435,590 | $671,429 |
| 2016 | $50,893 | $2,012,729 | $1,333,010 | $679,719 |
| 2015 | $44,885 | $1,965,122 | $1,285,403 | $679,719 |
| 2014 | $44,885 | $1,746,038 | $1,094,973 | $651,065 |
Source: Public Records
Map
Nearby Homes
- 2204 Inwood Dr
- 2131 Brentwood Dr
- 2217 Pelham Dr
- 2413 Brentwood Dr
- 2233 Pelham Dr
- 2105 Del Monte Dr
- 2249 Pelham Dr
- 2247 Chilton Rd
- 1601 S Shepherd Dr Unit 20
- 1601 S Shepherd Dr Unit 29
- 1601 S Shepherd Dr Unit 138
- 1561 Kirby Dr
- 2525 Inwood Dr
- 1915 Spann St
- 1711 Huldy St Unit A
- 1216 S Shepherd Dr
- 2323 San Felipe St Unit 901
- 2323 San Felipe St Unit 1101
- 2323 San Felipe St Unit 602
- 2100 Welch St Unit C113
- 2148 Inwood Dr
- 2136 Inwood Dr
- 2130 Inwood Dr
- 2145 Brentwood Dr
- 2154 Inwood Dr
- 2153 Brentwood Dr
- 2147 Inwood Dr
- 2133 Inwood Dr
- 2124 Inwood
- 2153 Inwood Dr
- 2129 Brentwood Dr
- 2124 S Inwood Dr
- 2203 Brentwood Dr
- 2127 Inwood Dr
- 2159 Inwood Dr
- 2118 Inwood Dr
- 2210 Inwood Dr
- 2205 Inwood Dr
- 2121 Brentwood Dr
- 2211 Brentwood Dr