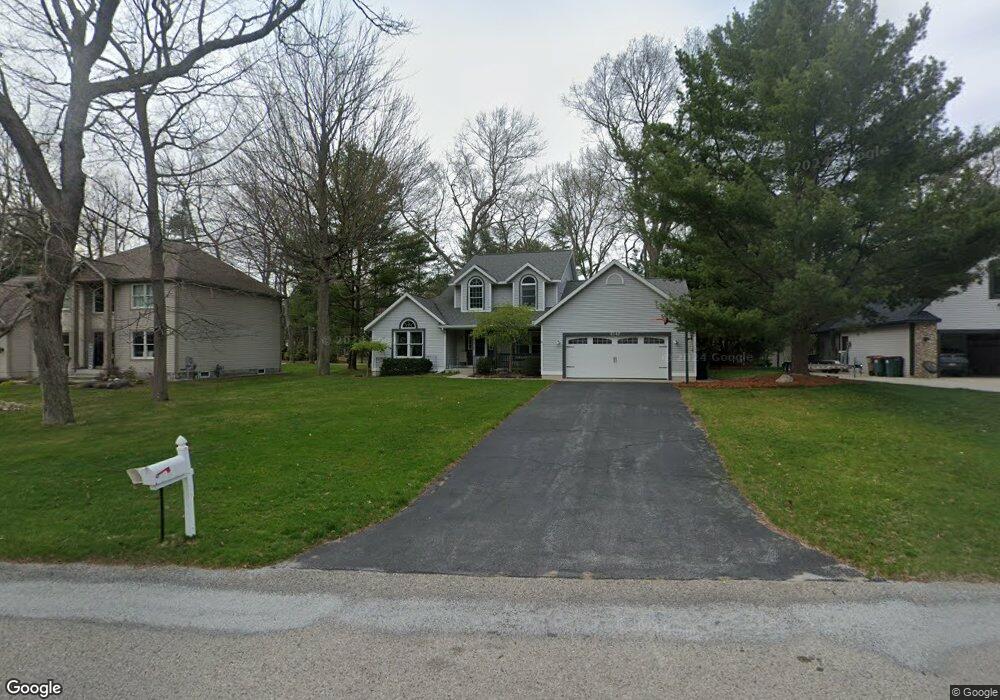
2142 Ridgeway Dr Norton Shores, MI 49441
Estimated Value: $461,000 - $514,000
3
Beds
3
Baths
2,660
Sq Ft
$187/Sq Ft
Est. Value
About This Home
This home is located at 2142 Ridgeway Dr, Norton Shores, MI 49441 and is currently estimated at $497,729, approximately $187 per square foot. 2142 Ridgeway Dr is a home located in Muskegon County with nearby schools including Mona Shores High School, West Shore Lutheran School, and St. Francis De Sales Elementary School.
Ownership History
Date
Name
Owned For
Owner Type
Purchase Details
Closed on
Feb 15, 2017
Sold by
Bayne David
Bought by
Bayne Lisa
Current Estimated Value
Purchase Details
Closed on
Sep 16, 2010
Sold by
Bayne David L and Bayne Lisa Fay
Bought by
Bayne David L and Bayne Lisa Fay
Purchase Details
Closed on
Feb 28, 2006
Sold by
Duggins Greg W and Duggins Anna K
Bought by
Bayne David L
Home Financials for this Owner
Home Financials are based on the most recent Mortgage that was taken out on this home.
Original Mortgage
$204,000
Outstanding Balance
$114,131
Interest Rate
6%
Mortgage Type
Fannie Mae Freddie Mac
Estimated Equity
$383,598
Purchase Details
Closed on
Aug 18, 2004
Sold by
Eyerman Frederick L and Eyerman Kathryn J
Bought by
Duggins Greg W and Duggins Anna K
Home Financials for this Owner
Home Financials are based on the most recent Mortgage that was taken out on this home.
Original Mortgage
$216,800
Interest Rate
5%
Mortgage Type
Purchase Money Mortgage
Create a Home Valuation Report for This Property
The Home Valuation Report is an in-depth analysis detailing your home's value as well as a comparison with similar homes in the area
Home Values in the Area
Average Home Value in this Area
Purchase History
| Date | Buyer | Sale Price | Title Company |
|---|---|---|---|
| Bayne Lisa | -- | Attorney | |
| Bayne David L | -- | Safe Title Inc | |
| Bayne David L | -- | None Available | |
| Duggins Greg W | $271,000 | -- |
Source: Public Records
Mortgage History
| Date | Status | Borrower | Loan Amount |
|---|---|---|---|
| Open | Bayne David L | $204,000 | |
| Previous Owner | Duggins Greg W | $216,800 |
Source: Public Records
Tax History Compared to Growth
Tax History
| Year | Tax Paid | Tax Assessment Tax Assessment Total Assessment is a certain percentage of the fair market value that is determined by local assessors to be the total taxable value of land and additions on the property. | Land | Improvement |
|---|---|---|---|---|
| 2025 | $5,488 | $236,400 | $0 | $0 |
| 2024 | $4,302 | $221,200 | $0 | $0 |
| 2023 | $4,109 | $184,700 | $0 | $0 |
| 2022 | $5,009 | $151,800 | $0 | $0 |
| 2021 | $4,867 | $143,300 | $0 | $0 |
| 2020 | $4,812 | $144,000 | $0 | $0 |
| 2019 | $4,724 | $140,700 | $0 | $0 |
| 2018 | $4,613 | $126,100 | $0 | $0 |
| 2017 | $4,506 | $124,600 | $0 | $0 |
| 2016 | $3,470 | $115,900 | $0 | $0 |
| 2015 | -- | $112,300 | $0 | $0 |
| 2014 | $4,163 | $116,000 | $0 | $0 |
| 2013 | -- | $108,200 | $0 | $0 |
Source: Public Records
Map
Nearby Homes
- 2097 Geneva Ln
- 1905 Crestwood Ln
- 1991 W Glen Ct
- 2147 Easthill Dr
- 1812 Ritter Hills Dr
- 2290 Blissfield Ct
- 4057 Dunes Pkwy
- 1947 Spencer Dr
- 2115 Garland Dr
- 2059 Garland Dr
- 3891 Wickham Dr
- 2298 Norcrest Dr
- 4235 Braeburn Ct
- 4230 Braeburn Ct
- 3658 Lake Harbor Rd
- 3920 Braeburn Dr
- 1558 Brookwood Dr
- 1769 Bayview Dr
- 1744 W Norton Ave
- 3283 Mccracken St
- 2124 Ridgeway Dr
- 2160 Ridgeway Dr
- 2157 Geneva Ln
- 2121 Geneva Ln
- 2139 Geneva Ln
- 4088 Treeline Dr
- 2139 Ridgeway Dr
- 2121 Ridgeway Dr
- 2106 Ridgeway Dr
- 2157 Ridgeway Dr
- 2107 Geneva Ln
- 2160 Geneva Ln
- 4080 Treeline Dr
- 4136 Treeline Dr
- 2101 Ridgeway Dr
- 0 Ridgeway Dr
- 2142 Forest View Dr
- 2142 Geneva Ln
- 2124 Forest View Dr
- 2160 Forest View Dr