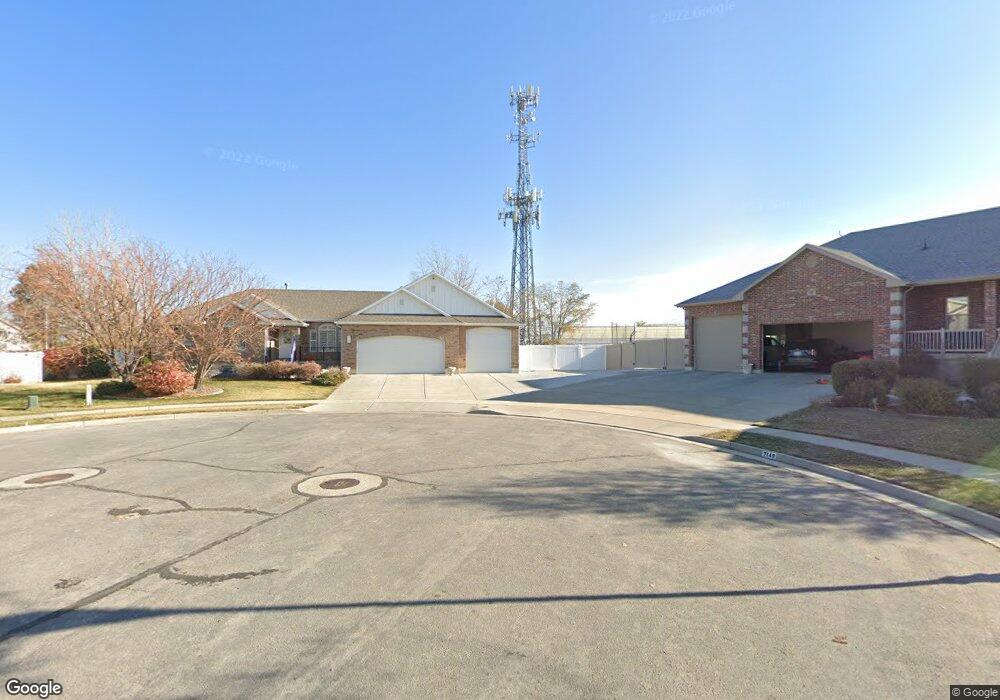
2142 W 1080 N Clearfield, UT 84015
Estimated Value: $623,000 - $720,000
6
Beds
4
Baths
3,535
Sq Ft
$193/Sq Ft
Est. Value
About This Home
This home is located at 2142 W 1080 N, Clearfield, UT 84015 and is currently estimated at $681,120, approximately $192 per square foot. 2142 W 1080 N is a home located in Davis County with nearby schools including Lakeside School, West Point Junior High School, and Syracuse High School.
Ownership History
Date
Name
Owned For
Owner Type
Purchase Details
Closed on
Jan 2, 2003
Sold by
Poll Scott and Poll Peggy
Bought by
Farr David M and Farr Tracey A
Current Estimated Value
Home Financials for this Owner
Home Financials are based on the most recent Mortgage that was taken out on this home.
Original Mortgage
$227,610
Outstanding Balance
$111,684
Interest Rate
8.25%
Estimated Equity
$569,436
Purchase Details
Closed on
Mar 28, 2002
Sold by
Nelson & Nelson Construction Inc
Bought by
Poll Scott and Poll Peggy
Home Financials for this Owner
Home Financials are based on the most recent Mortgage that was taken out on this home.
Original Mortgage
$100,000
Interest Rate
6.84%
Purchase Details
Closed on
Nov 13, 2001
Sold by
Clinton Fields Lc
Bought by
Nelson & Nelson Construction Inc
Home Financials for this Owner
Home Financials are based on the most recent Mortgage that was taken out on this home.
Original Mortgage
$148,500
Interest Rate
6.62%
Mortgage Type
Construction
Create a Home Valuation Report for This Property
The Home Valuation Report is an in-depth analysis detailing your home's value as well as a comparison with similar homes in the area
Home Values in the Area
Average Home Value in this Area
Purchase History
| Date | Buyer | Sale Price | Title Company |
|---|---|---|---|
| Farr David M | -- | Heritage West Title Insuranc | |
| Poll Scott | -- | Heritage West Title Insuranc | |
| Nelson & Nelson Construction Inc | -- | Heritage West Title Insuranc |
Source: Public Records
Mortgage History
| Date | Status | Borrower | Loan Amount |
|---|---|---|---|
| Open | Farr David M | $227,610 | |
| Previous Owner | Poll Scott | $100,000 | |
| Previous Owner | Nelson & Nelson Construction Inc | $148,500 | |
| Closed | Farr David M | $25,290 |
Source: Public Records
Tax History Compared to Growth
Tax History
| Year | Tax Paid | Tax Assessment Tax Assessment Total Assessment is a certain percentage of the fair market value that is determined by local assessors to be the total taxable value of land and additions on the property. | Land | Improvement |
|---|---|---|---|---|
| 2025 | $3,844 | $369,600 | $121,349 | $248,251 |
| 2024 | $3,852 | $372,350 | $130,348 | $242,002 |
| 2023 | $3,377 | $604,000 | $153,665 | $450,335 |
| 2022 | $3,258 | $322,300 | $87,554 | $234,746 |
| 2021 | $3,005 | $441,000 | $120,641 | $320,359 |
| 2020 | $2,623 | $381,000 | $108,825 | $272,175 |
| 2019 | $2,558 | $363,000 | $115,664 | $247,336 |
| 2018 | $2,432 | $339,000 | $96,275 | $242,725 |
| 2016 | $2,236 | $160,985 | $36,362 | $124,623 |
| 2015 | $2,210 | $151,250 | $36,362 | $114,888 |
| 2014 | $1,845 | $128,301 | $36,362 | $91,939 |
| 2013 | -- | $150,528 | $33,650 | $116,878 |
Source: Public Records
Map
Nearby Homes
- 2156 W 1080 N
- 2149 W 1080 N
- 2137 W 1145 N
- 2137 W 1145 N Unit 26
- 2153 W 1145 N
- 2153 W 1145 N Unit 27
- 2163 W 1080 N
- 2178 W 1080 N
- 2187 W 1080 N
- 2187 W 1080 N Unit 36
- 1136 N 2220 W
- 1124 N 2220 W
- 1124 N 2220 W Unit 29
- 2204 W 1080 N
- 1071 N 2000 W
- 2136 W 1145 N
- 2136 W 1145 N Unit 25
- 2158 W 1145 N
- 1062 N 2220 W Unit 37
- 1062 N 2220 W