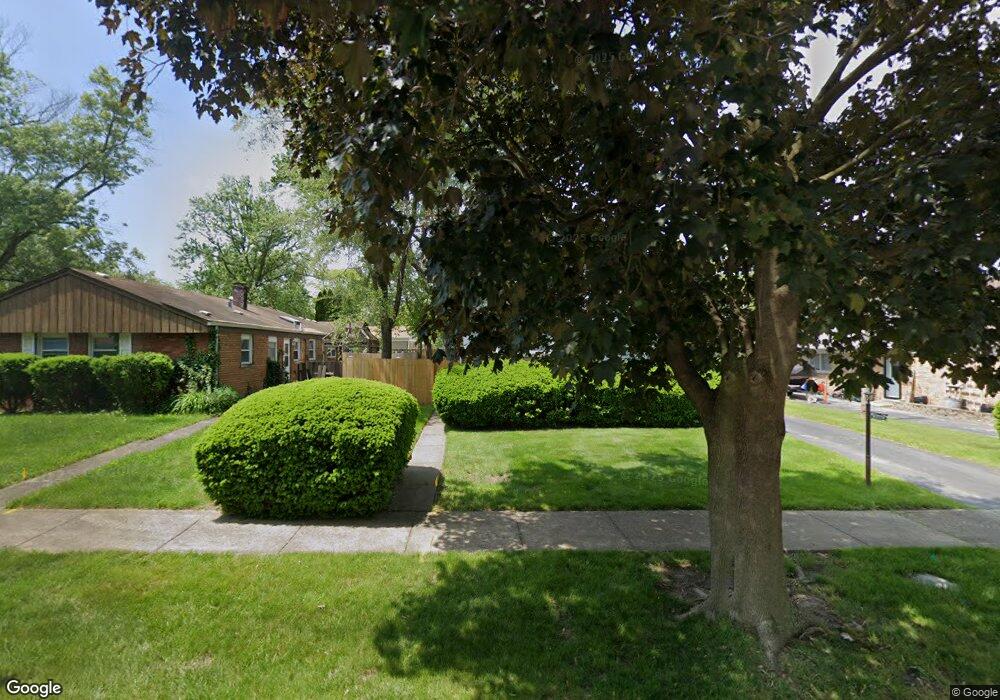
21420 S Quinn Ave Matteson, IL 60443
Old Matteson NeighborhoodEstimated Value: $186,000 - $231,000
4
Beds
2
Baths
1,300
Sq Ft
$160/Sq Ft
Est. Value
About This Home
This home is located at 21420 S Quinn Ave, Matteson, IL 60443 and is currently estimated at $207,774, approximately $159 per square foot. 21420 S Quinn Ave is a home located in Cook County with nearby schools including Illinois School, Matteson Elementary School, and Sauk Elementary School.
Ownership History
Date
Name
Owned For
Owner Type
Purchase Details
Closed on
Jun 13, 2007
Sold by
Harris Na
Bought by
Wiley Jessina L
Current Estimated Value
Home Financials for this Owner
Home Financials are based on the most recent Mortgage that was taken out on this home.
Original Mortgage
$154,900
Outstanding Balance
$95,141
Interest Rate
6.26%
Mortgage Type
Unknown
Estimated Equity
$112,633
Purchase Details
Closed on
Sep 14, 2005
Sold by
Jarrett Rhonda
Bought by
Harris Na and Land Trust #L-4010
Purchase Details
Closed on
Jun 20, 2003
Sold by
Kuse Judith and Fullerton Judith
Bought by
Jarrett Rhonda
Home Financials for this Owner
Home Financials are based on the most recent Mortgage that was taken out on this home.
Original Mortgage
$94,000
Interest Rate
10.62%
Mortgage Type
Unknown
Purchase Details
Closed on
Dec 30, 2000
Sold by
Maier Maier Fred A Fred A
Bought by
Kuse Judith
Home Financials for this Owner
Home Financials are based on the most recent Mortgage that was taken out on this home.
Original Mortgage
$107,250
Interest Rate
9.5%
Create a Home Valuation Report for This Property
The Home Valuation Report is an in-depth analysis detailing your home's value as well as a comparison with similar homes in the area
Home Values in the Area
Average Home Value in this Area
Purchase History
| Date | Buyer | Sale Price | Title Company |
|---|---|---|---|
| Wiley Jessina L | $155,000 | Fatic | |
| Harris Na | $107,000 | First American | |
| Jarrett Rhonda | $94,000 | Cti | |
| Kuse Judith | $60,000 | -- |
Source: Public Records
Mortgage History
| Date | Status | Borrower | Loan Amount |
|---|---|---|---|
| Open | Wiley Jessina L | $154,900 | |
| Previous Owner | Jarrett Rhonda | $94,000 | |
| Previous Owner | Kuse Judith | $107,250 |
Source: Public Records
Tax History Compared to Growth
Tax History
| Year | Tax Paid | Tax Assessment Tax Assessment Total Assessment is a certain percentage of the fair market value that is determined by local assessors to be the total taxable value of land and additions on the property. | Land | Improvement |
|---|---|---|---|---|
| 2024 | $7,026 | $17,000 | $3,000 | $14,000 |
| 2023 | $4,847 | $17,000 | $3,000 | $14,000 |
| 2022 | $4,847 | $8,936 | $2,625 | $6,311 |
| 2021 | $4,914 | $8,935 | $2,625 | $6,310 |
| 2020 | $4,551 | $8,935 | $2,625 | $6,310 |
| 2019 | $5,338 | $10,313 | $2,437 | $7,876 |
| 2018 | $5,337 | $10,313 | $2,437 | $7,876 |
| 2017 | $5,123 | $10,313 | $2,437 | $7,876 |
| 2016 | $5,176 | $10,527 | $2,250 | $8,277 |
| 2015 | $5,131 | $10,527 | $2,250 | $8,277 |
| 2014 | $4,971 | $10,527 | $2,250 | $8,277 |
| 2013 | $4,839 | $11,211 | $2,250 | $8,961 |
Source: Public Records
Map
Nearby Homes
- 3919 214th St
- 3809 215th St
- 3865 216th St
- 3727 214th Place Unit 2
- 3712 214th St
- 3704 215th St Unit 205
- 3762 216th Place
- 3817 216th Place
- 21142 Locust St
- 4200 Washington Ave
- 3718 211th Place
- 21607 Main St
- 21209 Oak St
- 21829 Richton Rd
- 549 Homan Ave
- 305 Jackson St
- 3704 Linden Rd
- 820 Exmoor Rd
- 831 Violet Ln
- 21635 Dogwood Rd Unit 1165
- 3844 214th Place
- 21416 S Quinn Ave
- 21410 S Quinn Ave
- 21419 S Jean Ave
- 3902 214th Place
- 21417 S Jean Ave
- 21421 S Quinn Ave
- 21408 S Quinn Ave Unit 1
- 21417 S Quinn Ave
- 3841 214th Place
- 3901 214th Place Unit 1
- 3830 214th Place
- 21411 S Jean Ave
- 21413 S Quinn Ave
- 3837 214th Place
- 3905 214th Place
- 21406 S Quinn Ave
- 3833 214th Place
- 21412 Butterfield Pkwy
- 3909 214th Place