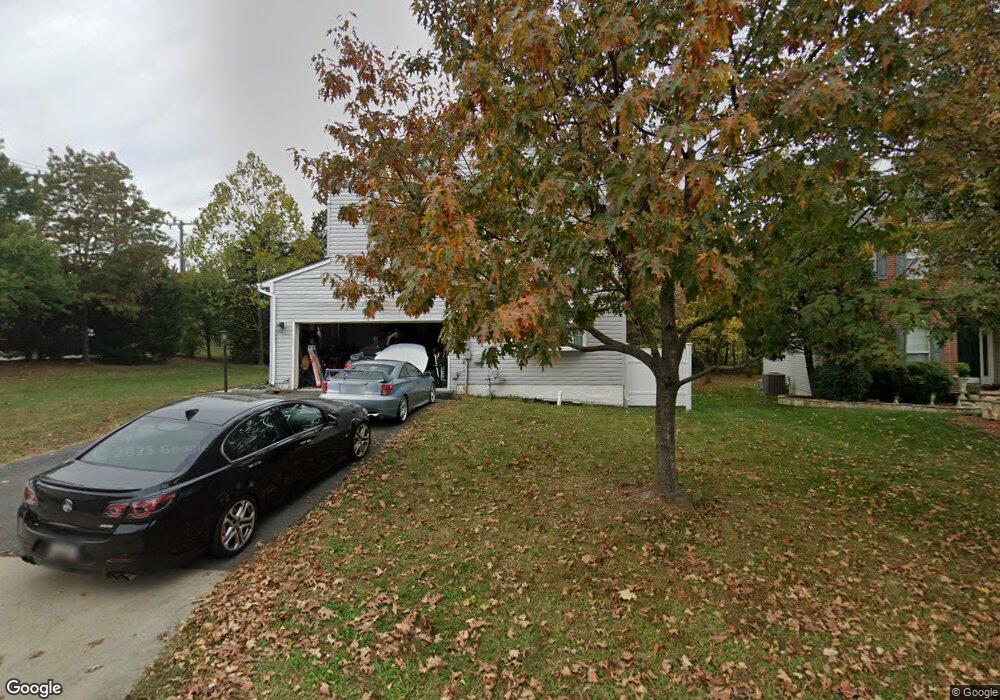
21423 Ashburn Run Place Ashburn, VA 20147
Estimated Value: $949,000 - $1,077,000
5
Beds
4
Baths
2,892
Sq Ft
$350/Sq Ft
Est. Value
About This Home
This home is located at 21423 Ashburn Run Place, Ashburn, VA 20147 and is currently estimated at $1,010,907, approximately $349 per square foot. 21423 Ashburn Run Place is a home located in Loudoun County with nearby schools including Cedar Lane Elementary School, Trailside Middle School, and Stone Bridge High.
Ownership History
Date
Name
Owned For
Owner Type
Purchase Details
Closed on
Mar 31, 2006
Sold by
Singh Sukhbinder
Bought by
Villazon Wajiha
Current Estimated Value
Home Financials for this Owner
Home Financials are based on the most recent Mortgage that was taken out on this home.
Original Mortgage
$459,200
Outstanding Balance
$263,277
Interest Rate
6.32%
Mortgage Type
New Conventional
Estimated Equity
$747,630
Purchase Details
Closed on
Dec 29, 2003
Sold by
Mcdonald Anthony A E
Bought by
Singh Sukhbinder J
Home Financials for this Owner
Home Financials are based on the most recent Mortgage that was taken out on this home.
Original Mortgage
$372,000
Interest Rate
6.01%
Mortgage Type
New Conventional
Purchase Details
Closed on
Mar 1, 2002
Sold by
Richmond American Hms Of
Bought by
Mcdonald Anthony
Home Financials for this Owner
Home Financials are based on the most recent Mortgage that was taken out on this home.
Original Mortgage
$328,200
Interest Rate
6.85%
Mortgage Type
New Conventional
Create a Home Valuation Report for This Property
The Home Valuation Report is an in-depth analysis detailing your home's value as well as a comparison with similar homes in the area
Home Values in the Area
Average Home Value in this Area
Purchase History
| Date | Buyer | Sale Price | Title Company |
|---|---|---|---|
| Villazon Wajiha | $656,000 | -- | |
| Singh Sukhbinder J | $405,000 | -- | |
| Mcdonald Anthony | $410,285 | -- |
Source: Public Records
Mortgage History
| Date | Status | Borrower | Loan Amount |
|---|---|---|---|
| Open | Villazon Wajiha | $459,200 | |
| Previous Owner | Singh Sukhbinder J | $372,000 | |
| Previous Owner | Mcdonald Anthony | $328,200 |
Source: Public Records
Tax History Compared to Growth
Tax History
| Year | Tax Paid | Tax Assessment Tax Assessment Total Assessment is a certain percentage of the fair market value that is determined by local assessors to be the total taxable value of land and additions on the property. | Land | Improvement |
|---|---|---|---|---|
| 2025 | $7,312 | $908,330 | $302,100 | $606,230 |
| 2024 | $7,443 | $860,490 | $302,100 | $558,390 |
| 2023 | $7,538 | $861,540 | $274,100 | $587,440 |
| 2022 | $7,062 | $793,450 | $247,100 | $546,350 |
| 2021 | $6,211 | $633,820 | $202,100 | $431,720 |
| 2020 | $6,391 | $617,490 | $202,100 | $415,390 |
| 2019 | $6,206 | $593,830 | $202,100 | $391,730 |
| 2018 | $5,985 | $551,590 | $182,100 | $369,490 |
| 2017 | $6,026 | $535,600 | $182,100 | $353,500 |
| 2016 | $6,294 | $549,660 | $0 | $0 |
| 2015 | $6,113 | $356,460 | $0 | $356,460 |
| 2014 | $6,381 | $370,350 | $0 | $370,350 |
Source: Public Records
Map
Nearby Homes
- 21506 Shellhorn Rd
- 21493 Willow Breeze Square
- 43314 Fullerton St
- 43442 Nottingham Square
- 21562 Iredell Terrace
- 21229 Greenspring Ct
- 43564 Golden Meadow Cir
- 21748 Kings Crossing Terrace
- 43322 Novi Terrace
- 21329 Thimbleweed Ct
- 43381 Rickenbacker Square
- 43497 Farringdon Square
- 21744 Dollis Hill Terrace
- 21746 Dollis Hill Terrace
- 21823 Beckhorn Station Terrace
- 21754 Dollis Hill Terrace
- 21756 Dollis Hill Terrace
- 43382 Farringdon Square
- 43376 Farringdon Square
- 21843 Beckhorn Station Terrace
- 21419 Ashburn Run Place
- 21422 Ashburn Run Place
- 21415 Ashburn Run Place
- 21418 Ashburn Run Place
- 21414 Ashburn Run Place
- 21414 Ashburn Run Place Unit BASEMENT
- 21561 Center Point Cir
- 21565 Center Point Cir
- 21411 Ashburn Run Place
- 21557 Center Point Cir
- 43330 Columbus St
- 21410 Ashburn Run Place
- 21395 Marble Chip Ct
- 21394 Marble Chip Ct
- 21553 Center Point Cir
- 43326 Columbus St
- 21407 Ashburn Run Place
- 43322 Columbus St
- 21549 Center Point Cir
- 43332 Claybrooke Cir