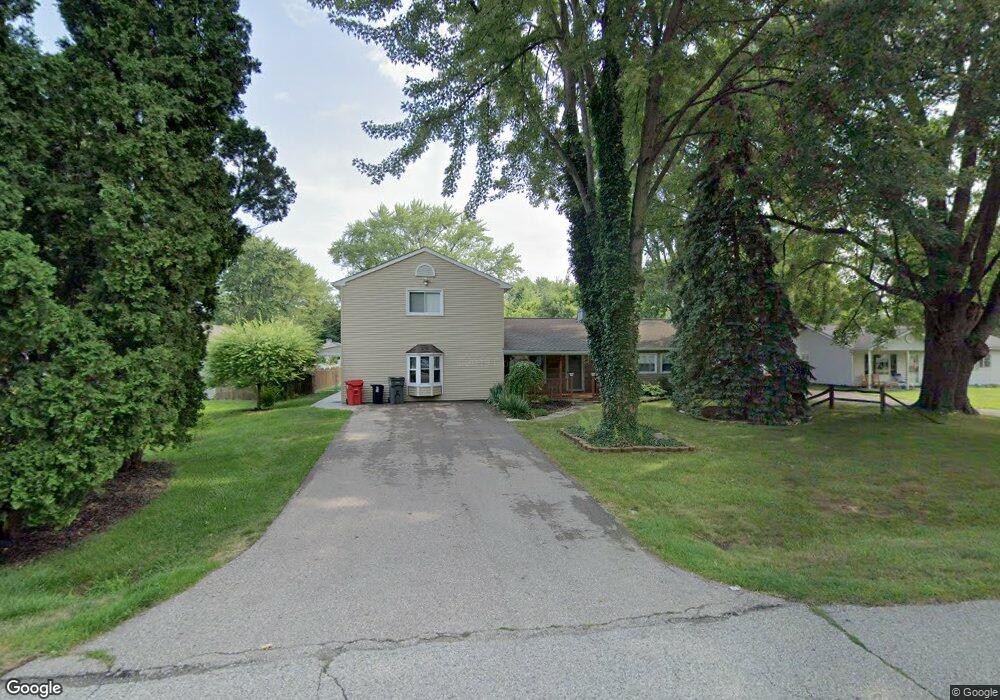
21425 Ulrich St Unit Bldg-Unit Clinton Township, MI 48036
Estimated Value: $339,000 - $378,000
5
Beds
3
Baths
2,743
Sq Ft
$132/Sq Ft
Est. Value
About This Home
This home is located at 21425 Ulrich St Unit Bldg-Unit, Clinton Township, MI 48036 and is currently estimated at $361,423, approximately $131 per square foot. 21425 Ulrich St Unit Bldg-Unit is a home located in Macomb County with nearby schools including Clinton Valley Elementary School, Algonquin Middle School, and Chippewa Valley High School.
Ownership History
Date
Name
Owned For
Owner Type
Purchase Details
Closed on
Sep 24, 2025
Sold by
Dunn Gregory P
Bought by
Jackson Stephanie and Mcgary Yolanda J
Current Estimated Value
Home Financials for this Owner
Home Financials are based on the most recent Mortgage that was taken out on this home.
Original Mortgage
$373,117
Outstanding Balance
$373,117
Interest Rate
6.58%
Mortgage Type
FHA
Estimated Equity
-$11,694
Purchase Details
Closed on
Mar 2, 2019
Sold by
Williams Marc
Bought by
Dunn Gregory P
Home Financials for this Owner
Home Financials are based on the most recent Mortgage that was taken out on this home.
Original Mortgage
$217,550
Interest Rate
4.4%
Mortgage Type
Purchase Money Mortgage
Purchase Details
Closed on
Jul 16, 2018
Sold by
Lentz Michael and Lentz Mary
Bought by
Williams Marc
Purchase Details
Closed on
Dec 20, 2007
Sold by
Bates Mandy J and Lentz Matthew E
Bought by
Lentz Michael E and Lentz Mary M
Create a Home Valuation Report for This Property
The Home Valuation Report is an in-depth analysis detailing your home's value as well as a comparison with similar homes in the area
Home Values in the Area
Average Home Value in this Area
Purchase History
| Date | Buyer | Sale Price | Title Company |
|---|---|---|---|
| Jackson Stephanie | $380,000 | None Listed On Document | |
| Dunn Gregory P | $229,000 | Amrock | |
| Williams Marc | $224,000 | First American Title | |
| Lentz Michael E | -- | None Available |
Source: Public Records
Mortgage History
| Date | Status | Borrower | Loan Amount |
|---|---|---|---|
| Open | Jackson Stephanie | $373,117 | |
| Previous Owner | Dunn Gregory P | $217,550 |
Source: Public Records
Tax History Compared to Growth
Tax History
| Year | Tax Paid | Tax Assessment Tax Assessment Total Assessment is a certain percentage of the fair market value that is determined by local assessors to be the total taxable value of land and additions on the property. | Land | Improvement |
|---|---|---|---|---|
| 2025 | $5,648 | $169,800 | $0 | $0 |
| 2024 | $3,365 | $155,400 | $0 | $0 |
| 2023 | $3,192 | $137,300 | $0 | $0 |
| 2022 | $5,118 | $130,100 | $0 | $0 |
| 2021 | $4,977 | $123,000 | $0 | $0 |
| 2020 | $2,928 | $116,100 | $0 | $0 |
| 2019 | $4,264 | $104,800 | $0 | $0 |
| 2018 | $3,021 | $96,300 | $0 | $0 |
| 2017 | $2,993 | $84,000 | $11,300 | $72,700 |
| 2016 | $2,975 | $84,000 | $0 | $0 |
| 2015 | -- | $76,400 | $0 | $0 |
| 2014 | -- | $71,900 | $0 | $0 |
| 2011 | -- | $76,100 | $15,900 | $60,200 |
Source: Public Records
Map
Nearby Homes
- 21361 Ulrich St
- 21510 Remick Dr
- 21445 Drexel St
- 21404 Drexel St
- 21769 Ulrich St
- 37335 Ilene St
- 37840 Culver Dr
- 37743 Rosedale Dr
- 20810 Gaslight Dr
- 20706 Gaslight Dr
- 20543 Glenallen Dr
- 21130 Parkplace Ln Unit 11
- 21885 N Nunneley Rd
- 37682 Charter Oaks Blvd
- 20902 Oak Ridge Dr Unit 45
- 37619 Charter Oaks Blvd Unit 222
- 21934 S Nunneley Rd
- 20463 Harmony Dr
- 37439 Charter Oaks Blvd Unit 114
- 20455 Palms Dr
- 21445 Ulrich St
- 21430 Highview St
- 37814 Emery St
- 21450 Highview St
- 21465 Ulrich St
- 21470 Highview St
- 21485 Ulrich St
- 21490 Highview St
- 37827 Emery St
- 21505 Ulrich St
- 37843 Emery St
- 21510 Highview St
- 21430 Ulrich St
- 37859 Emery St
- 21450 Ulrich St
- 37690 Emery St
- 21431 Highview St
- 21451 Highview St
- 21409 Highview St
- 21469 Highview St