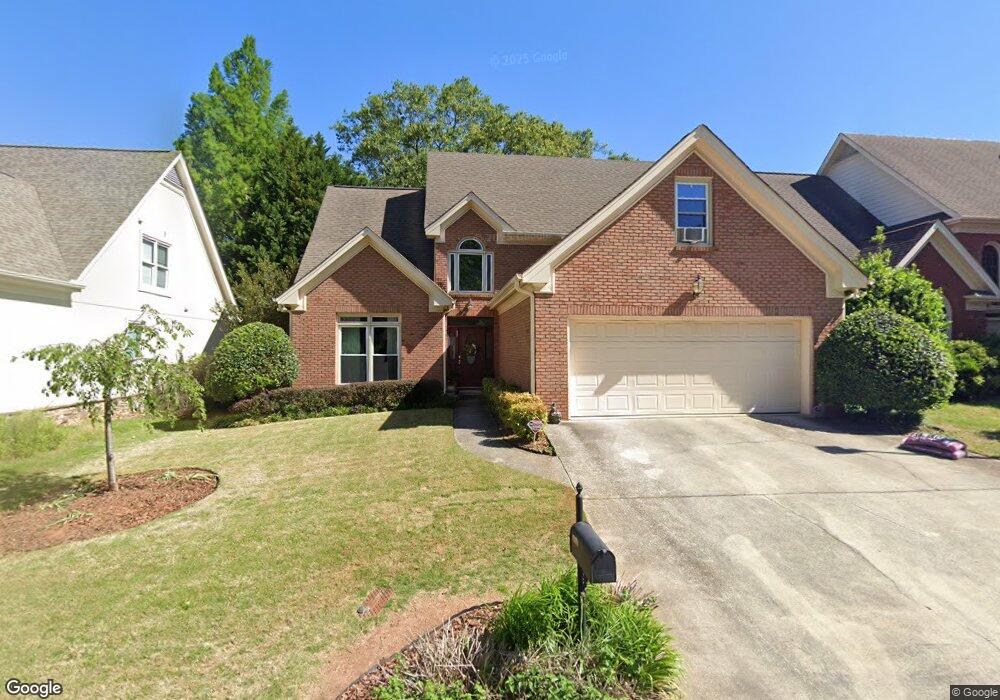
2143 Brownings Trace Tucker, GA 30084
Estimated Value: $453,046 - $535,000
3
Beds
3
Baths
2,485
Sq Ft
$198/Sq Ft
Est. Value
About This Home
This home is located at 2143 Brownings Trace, Tucker, GA 30084 and is currently estimated at $492,762, approximately $198 per square foot. 2143 Brownings Trace is a home located in DeKalb County with nearby schools including Brockett Elementary School, Tucker Middle School, and Tucker High School.
Ownership History
Date
Name
Owned For
Owner Type
Purchase Details
Closed on
Oct 9, 2015
Sold by
Brantley William S
Bought by
Brantley William S and Dison Lizbeth A
Current Estimated Value
Home Financials for this Owner
Home Financials are based on the most recent Mortgage that was taken out on this home.
Original Mortgage
$140,500
Outstanding Balance
$83,891
Interest Rate
3.94%
Mortgage Type
New Conventional
Estimated Equity
$408,871
Purchase Details
Closed on
Nov 19, 1997
Sold by
Allen W Charles and Allen Sandra W
Bought by
Brantley William S and Dison Lizbeth
Home Financials for this Owner
Home Financials are based on the most recent Mortgage that was taken out on this home.
Original Mortgage
$173,700
Interest Rate
7.27%
Mortgage Type
New Conventional
Create a Home Valuation Report for This Property
The Home Valuation Report is an in-depth analysis detailing your home's value as well as a comparison with similar homes in the area
Home Values in the Area
Average Home Value in this Area
Purchase History
| Date | Buyer | Sale Price | Title Company |
|---|---|---|---|
| Brantley William S | -- | -- | |
| Brantley William S | $193,000 | -- |
Source: Public Records
Mortgage History
| Date | Status | Borrower | Loan Amount |
|---|---|---|---|
| Open | Brantley William S | $140,500 | |
| Previous Owner | Brantley William S | $173,700 |
Source: Public Records
Tax History Compared to Growth
Tax History
| Year | Tax Paid | Tax Assessment Tax Assessment Total Assessment is a certain percentage of the fair market value that is determined by local assessors to be the total taxable value of land and additions on the property. | Land | Improvement |
|---|---|---|---|---|
| 2025 | $5,983 | $191,480 | $36,000 | $155,480 |
| 2024 | $8,071 | $170,720 | $36,000 | $134,720 |
| 2023 | $8,071 | $164,000 | $36,000 | $128,000 |
| 2022 | $4,803 | $163,760 | $30,000 | $133,760 |
| 2021 | $3,886 | $121,560 | $30,000 | $91,560 |
| 2020 | $3,335 | $99,480 | $24,080 | $75,400 |
| 2019 | $3,359 | $102,280 | $24,080 | $78,200 |
| 2018 | $3,565 | $115,000 | $24,080 | $90,920 |
| 2017 | $3,592 | $106,040 | $24,080 | $81,960 |
| 2016 | $3,190 | $110,200 | $24,080 | $86,120 |
| 2014 | $2,799 | $83,000 | $17,430 | $65,570 |
Source: Public Records
Map
Nearby Homes
- 4217 Theresa Ct
- 2215 Nena Way Unit 20
- 2219 Nena Way Unit 22
- 4365 Cowan Rd
- 2154 Brockett Rd
- 2278 Dillard Crossing
- 2225 Dillard Crossing
- 4360 Sasanqua Ct Unit 2
- 4339 Sasanqua Ct
- 4345 Sasanqua Ct
- 3962 Brockett Walk
- 2063 Willow Chase Ct
- 3944 Woburn Dr Unit 3
- 2089 Carthage Rd
- 2520 Summeroak Dr
- 4322 Idlewood Ln
- 6105 Wayburn St
- 4312 Idlewood Ln
- 4383 Idlewood Ln
- 4338 Idlewood Ln
- 2151 Brownings Trace
- 2137 Brownings Trace
- 2161 Brownings Trace
- 2121 Brownings Trace
- 2107 Brownings Trace
- 2173 Fellowship Ct
- 2142 Browning Trace
- 2142 Brownings Trace
- 2136 Brownings Trace
- 2150 Brownings Trace
- 2176 Fellowship Ct
- 2130 Brownings Trace
- 2154 Brownings Trace
- 4225 Westbrook Ct
- 2106 Brownings Trace
- 2126 Brownings Trace
- 2158 Brownings Trace
- 2162 Brownings Trace
- 2166 Brownings Trace
- 4231 Westbrook Ct