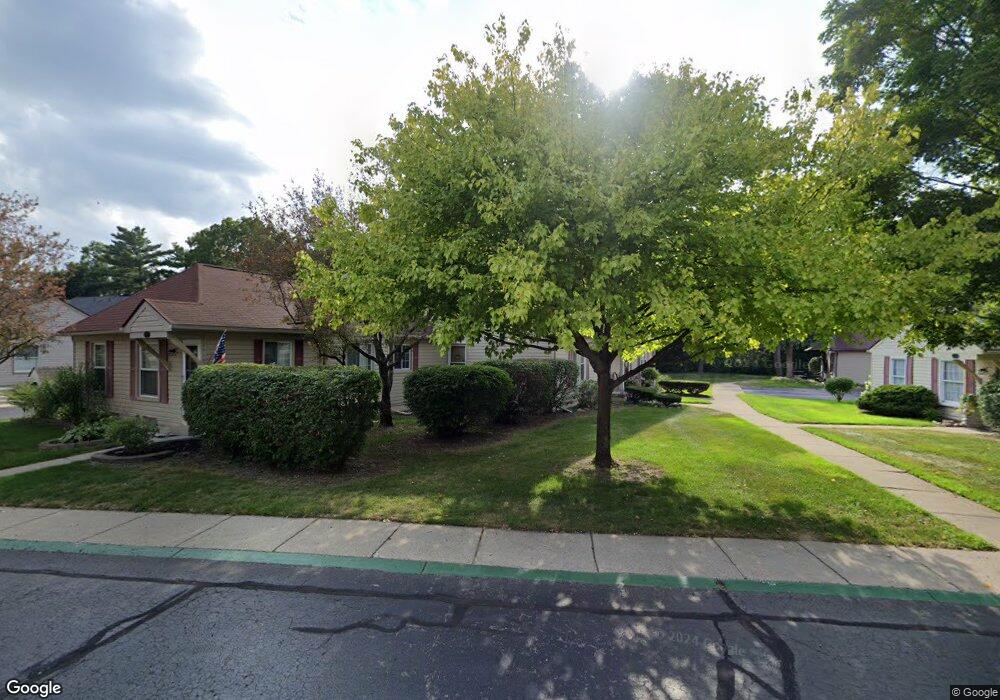
2143 Park Place Dr Unit 5 Walled Lake, MI 48390
Estimated Value: $159,000 - $183,000
2
Beds
1
Bath
900
Sq Ft
$191/Sq Ft
Est. Value
About This Home
This home is located at 2143 Park Place Dr Unit 5, Walled Lake, MI 48390 and is currently estimated at $172,006, approximately $191 per square foot. 2143 Park Place Dr Unit 5 is a home located in Oakland County with nearby schools including Mary Helen Guest Elementary School, James R Geisler Middle School, and Walled Lake Central High School.
Ownership History
Date
Name
Owned For
Owner Type
Purchase Details
Closed on
Sep 8, 2017
Sold by
Yungkans Lorraine L
Bought by
Manning Ilene
Current Estimated Value
Purchase Details
Closed on
Jan 8, 2014
Sold by
Liebau Cynthia G
Bought by
Yungkans Lorraine L
Purchase Details
Closed on
Jan 11, 2012
Sold by
Oakland County Treasurer
Bought by
Youngkans Lorraine
Purchase Details
Closed on
Aug 19, 1999
Sold by
Shekell Richard E
Bought by
Opiteck Rosalie
Purchase Details
Closed on
Sep 29, 1994
Sold by
Walters Violet I
Bought by
Shekell Richard E
Home Financials for this Owner
Home Financials are based on the most recent Mortgage that was taken out on this home.
Original Mortgage
$45,000
Interest Rate
8.55%
Mortgage Type
New Conventional
Create a Home Valuation Report for This Property
The Home Valuation Report is an in-depth analysis detailing your home's value as well as a comparison with similar homes in the area
Home Values in the Area
Average Home Value in this Area
Purchase History
| Date | Buyer | Sale Price | Title Company |
|---|---|---|---|
| Manning Ilene | $109,000 | None Available | |
| Yungkans Lorraine L | -- | None Available | |
| Youngkans Lorraine | $2,574 | None Available | |
| Opiteck Rosalie | $102,000 | -- | |
| Shekell Richard E | $62,500 | -- |
Source: Public Records
Mortgage History
| Date | Status | Borrower | Loan Amount |
|---|---|---|---|
| Previous Owner | Shekell Richard E | $45,000 |
Source: Public Records
Tax History Compared to Growth
Tax History
| Year | Tax Paid | Tax Assessment Tax Assessment Total Assessment is a certain percentage of the fair market value that is determined by local assessors to be the total taxable value of land and additions on the property. | Land | Improvement |
|---|---|---|---|---|
| 2024 | $1,876 | $67,480 | $0 | $0 |
| 2023 | $1,768 | $61,710 | $0 | $0 |
| 2022 | $1,761 | $53,870 | $0 | $0 |
| 2021 | $1,784 | $52,070 | $0 | $0 |
| 2020 | $1,705 | $49,810 | $0 | $0 |
| 2019 | $1,757 | $46,270 | $0 | $0 |
| 2018 | $1,754 | $39,550 | $0 | $0 |
| 2017 | $1,927 | $38,430 | $0 | $0 |
| 2016 | $1,930 | $36,000 | $0 | $0 |
| 2015 | -- | $31,320 | $0 | $0 |
| 2014 | -- | $24,530 | $0 | $0 |
| 2011 | -- | $24,510 | $0 | $0 |
Source: Public Records
Map
Nearby Homes
- 2130 Park Place Dr
- 2144 Park Place Dr
- 2230 Briar Ridge
- 2159 Helmsford Dr
- 275 Angola St
- 2145 Helmsford Dr
- 2450 S Commerce Rd
- 1131 Indianwood Trail Unit 12
- 2160 Newport Ct
- 1687 Bolton St
- 1747 Shankin Dr
- 2323 Solano Dr
- 1904 Meadow Ridge Dr
- 1439 Shankin Dr
- 2551 Oakview Dr
- 1128 Annjo St
- 60750 N Pontiac Trail
- 688 Wolverine Dr
- 8102 Heron Hills Dr
- 826 Wolverine Dr
- 2143 Park Place Dr
- 2143 Park Place Dr Unit 2 5
- 2149 Park Place Dr Unit 8
- 2147 Park Place Dr
- 2145 Park Place Dr Unit 6
- 2145 Park Place Dr
- 2145 Park Place Dr Unit 2, 06
- 2151 Park Place Dr
- 2141 Park Place Dr Unit 35
- 2139 Park Place Dr
- 2137 Park Place Dr Unit 33
- 2155 Park Place Dr Unit 15
- 2124 Park Place Dr Unit Bldg-Unit
- 2144 Park Place Dr Unit 5
- 2121 Park Place Dr Unit 43
- 2123 Park Place Dr Unit 42
- 2125 Park Place Dr
- 2113 Park Place Dr Unit 31
- 2115 Park Place Dr Unit 30
- 2117 Park Place Dr Unit 29