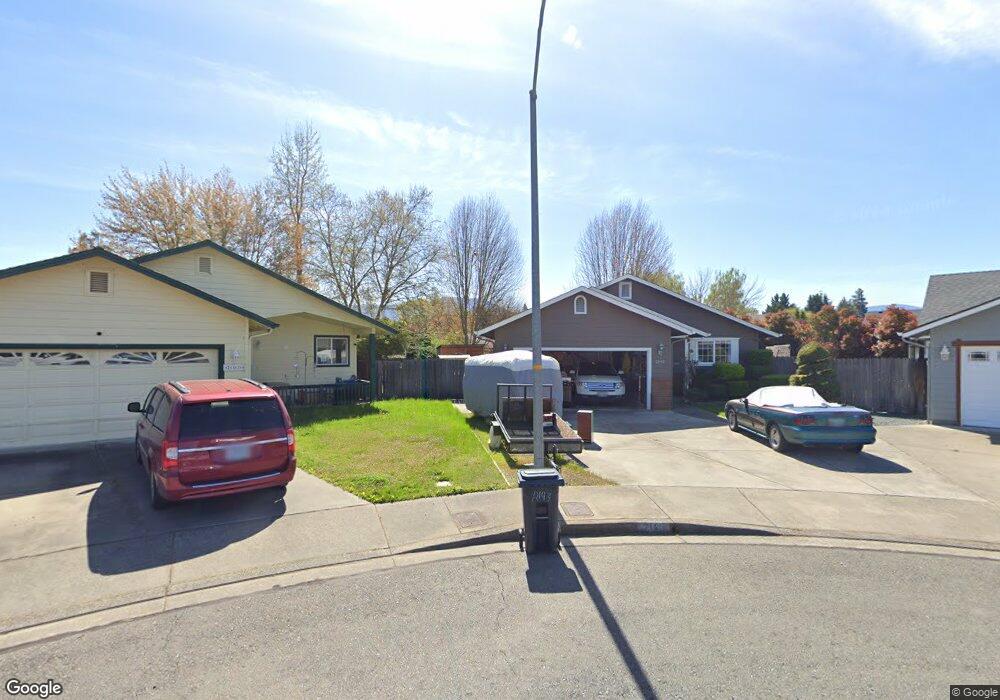
2143 SW Garden Valley Way Grants Pass, OR 97526
Estimated Value: $340,174 - $357,000
3
Beds
2
Baths
1,211
Sq Ft
$288/Sq Ft
Est. Value
About This Home
This home is located at 2143 SW Garden Valley Way, Grants Pass, OR 97526 and is currently estimated at $348,587, approximately $287 per square foot. 2143 SW Garden Valley Way is a home located in Josephine County with nearby schools including Ft. Vannoy Elementary School, Fleming Middle School, and North Valley High School.
Ownership History
Date
Name
Owned For
Owner Type
Purchase Details
Closed on
Dec 15, 2022
Sold by
Brosh Donna B and Lenz David L
Bought by
Lenz David L
Current Estimated Value
Home Financials for this Owner
Home Financials are based on the most recent Mortgage that was taken out on this home.
Original Mortgage
$186,500
Outstanding Balance
$180,314
Interest Rate
6.58%
Mortgage Type
New Conventional
Estimated Equity
$168,273
Purchase Details
Closed on
Jun 19, 2017
Sold by
Henderson Karl and Henderson Olga R
Bought by
Brosh Donna B and Lenz David L
Home Financials for this Owner
Home Financials are based on the most recent Mortgage that was taken out on this home.
Original Mortgage
$50,000
Interest Rate
4.05%
Mortgage Type
New Conventional
Purchase Details
Closed on
May 23, 2014
Sold by
Henderson Olga R and Glesby Olga R
Bought by
Henderson Olga R and Henderson Karl
Create a Home Valuation Report for This Property
The Home Valuation Report is an in-depth analysis detailing your home's value as well as a comparison with similar homes in the area
Home Values in the Area
Average Home Value in this Area
Purchase History
| Date | Buyer | Sale Price | Title Company |
|---|---|---|---|
| Lenz David L | $137,500 | None Listed On Document | |
| Brosh Donna B | $229,000 | Ticor Title Company Of Or | |
| Henderson Olga R | -- | None Available |
Source: Public Records
Mortgage History
| Date | Status | Borrower | Loan Amount |
|---|---|---|---|
| Open | Lenz David L | $186,500 | |
| Previous Owner | Brosh Donna B | $50,000 |
Source: Public Records
Tax History Compared to Growth
Tax History
| Year | Tax Paid | Tax Assessment Tax Assessment Total Assessment is a certain percentage of the fair market value that is determined by local assessors to be the total taxable value of land and additions on the property. | Land | Improvement |
|---|---|---|---|---|
| 2025 | $2,305 | $188,790 | -- | -- |
| 2024 | $2,305 | $183,300 | -- | -- |
| 2023 | $2,171 | $177,970 | $0 | $0 |
| 2022 | $2,182 | $172,790 | -- | -- |
| 2021 | $2,049 | $167,760 | $0 | $0 |
| 2020 | $2,065 | $162,880 | $0 | $0 |
| 2019 | $1,992 | $158,140 | $0 | $0 |
| 2018 | $2,041 | $153,540 | $0 | $0 |
| 2017 | $2,035 | $149,070 | $0 | $0 |
| 2016 | $1,787 | $144,730 | $0 | $0 |
| 2015 | $1,729 | $140,520 | $0 | $0 |
| 2014 | $717 | $58,140 | $0 | $0 |
Source: Public Records
Map
Nearby Homes
- 965 Roguelea Ln
- 930 Schaefers Ln
- 2393 SW Webster Rd
- 115 Orangewood Dr
- 127 Brentwood Dr
- 260 Lakeview Dr
- 901 Schaefers Ln
- 737 SW Kinsington Ct
- 789 Tami Rd
- 2082 Lower River Rd
- 311 Bandy Way
- 753 SW Kinsington Ct
- 751 SW Kinsington Ct
- 2309 SW Webster Rd
- 738 Lincoln Rd
- 2308 Lower River Rd
- 301 Bandy Way
- 2321 SW Webster Rd
- 126 SW Vicki Ln
- 206 Kingsbury Dr
- 2139 SW Garden Valley Way
- 2149 SW Garden Valley Way
- 2136 SW Webster Rd
- 1138 SW Ironwood Dr
- 2116 SW Webster Rd
- 1128 SW Ironwood Dr
- 2133 SW Garden Valley Way
- 2144 SW Garden Valley Way
- 1118 SW Ironwood Dr
- 2146 SW Webster Rd
- 1148 SW Ironwood Dr
- 2140 SW Garden Valley Way
- 2121 SW Garden Valley Way
- 2111 SW Garden Valley Way
- 2156 SW Webster Rd
- 1108 SW Ironwood Dr
- 1215 SW Ironwood Dr
- 1225 SW Ironwood Dr
- 1227 SW Ironwood Dr
- 2132 SW Garden Valley Way