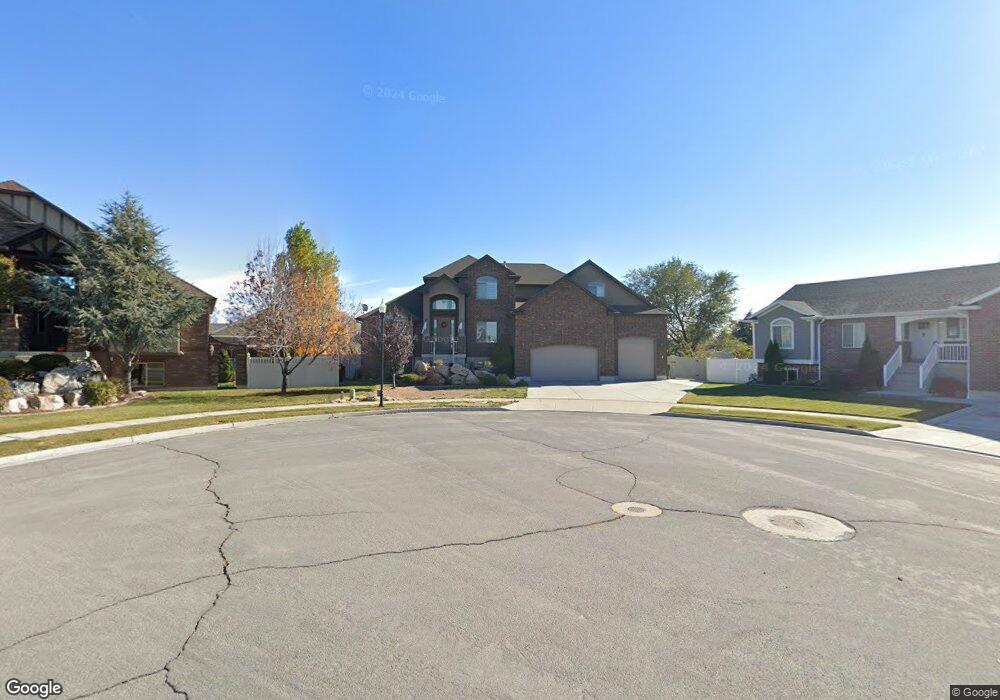
2143 W 1950 S Syracuse, UT 84075
Estimated Value: $786,000 - $814,000
6
Beds
4
Baths
4,303
Sq Ft
$186/Sq Ft
Est. Value
About This Home
This home is located at 2143 W 1950 S, Syracuse, UT 84075 and is currently estimated at $798,707, approximately $185 per square foot. 2143 W 1950 S is a home located in Davis County with nearby schools including Syracuse Elementary School, Syracuse Junior High School, and Syracuse High School.
Ownership History
Date
Name
Owned For
Owner Type
Purchase Details
Closed on
May 19, 2020
Sold by
Mormino Rosario J and Mormino Deborah Ann
Bought by
Mormino Deborah Ann and Mormino Rosario Joseph
Current Estimated Value
Home Financials for this Owner
Home Financials are based on the most recent Mortgage that was taken out on this home.
Original Mortgage
$393,000
Outstanding Balance
$348,253
Interest Rate
3.3%
Mortgage Type
New Conventional
Estimated Equity
$450,454
Purchase Details
Closed on
Dec 30, 2008
Sold by
Mike Schultz Construction Inc
Bought by
Showman John R and Showman Kimberly
Home Financials for this Owner
Home Financials are based on the most recent Mortgage that was taken out on this home.
Original Mortgage
$323,074
Interest Rate
6.1%
Mortgage Type
VA
Create a Home Valuation Report for This Property
The Home Valuation Report is an in-depth analysis detailing your home's value as well as a comparison with similar homes in the area
Home Values in the Area
Average Home Value in this Area
Purchase History
| Date | Buyer | Sale Price | Title Company |
|---|---|---|---|
| Mormino Deborah Ann | -- | Us Title Company O | |
| Showman John R | -- | Mountain View Title |
Source: Public Records
Mortgage History
| Date | Status | Borrower | Loan Amount |
|---|---|---|---|
| Open | Mormino Deborah Ann | $393,000 | |
| Closed | Showman John R | $323,074 |
Source: Public Records
Tax History Compared to Growth
Tax History
| Year | Tax Paid | Tax Assessment Tax Assessment Total Assessment is a certain percentage of the fair market value that is determined by local assessors to be the total taxable value of land and additions on the property. | Land | Improvement |
|---|---|---|---|---|
| 2025 | $4,544 | $438,350 | $128,486 | $309,864 |
| 2024 | $4,252 | $413,050 | $109,715 | $303,335 |
| 2023 | $3,989 | $706,000 | $152,674 | $553,326 |
| 2022 | $4,234 | $410,850 | $87,406 | $323,444 |
| 2021 | $3,668 | $551,000 | $129,562 | $421,438 |
| 2020 | $3,280 | $477,000 | $111,124 | $365,876 |
| 2019 | $3,211 | $461,000 | $110,748 | $350,252 |
| 2018 | $3,004 | $428,000 | $105,810 | $322,190 |
| 2016 | $2,929 | $218,845 | $40,534 | $178,311 |
| 2015 | $2,877 | $204,765 | $40,534 | $164,231 |
| 2014 | $1,409 | $176,682 | $40,534 | $136,148 |
| 2013 | -- | $158,991 | $34,232 | $124,759 |
Source: Public Records
Map
Nearby Homes
- 1932 S 2150 W
- 2047 S 2000 W
- 2104 W 2200 S
- 2136 W 2200 S
- 4344 W 1825 S Unit 102
- 4354 W 1825 S Unit 104
- 4348 W 1825 S Unit 103
- 2297 W 2175 S
- 2000 S 1800 W
- 1918 S 2465 W
- 2194 S 1800 W
- 2082 S 1730 W
- 1641 S 2350 W Unit B
- 1836 W 2400 S
- 2641 W 2175 S
- 2679 W Antelope Dr
- 2503 S 1875 W
- 2236 S 2685 W
- 1466 Earl Cir
- 2208 W 2615 S Unit 141
- 1976 S Jackson Ln
- 2151 W 1950 S Unit 68
- 1986 S Jackson Ln Unit 401
- 1966 S Jackson Ln
- 1949 S 2150 W
- 2138 Craig Ln
- 2150 Craig Ln
- 2161 W 1950 S
- 2160 Craig Ln
- 2094 W Jackson Ln
- 1946 S 2150 W
- 2084 W Jackson Ln Unit 405
- 1937 S 2150 W
- 2169 W 1950 S
- 2149 Craig Ln
- 2021 S Jackson Ct
- 2021 S Jackson Ct Unit 418
- 2180 Craig Ln
- 2161 Craig Ln
- 2074 W Jackson Ln