21439 SE Ash St Gresham, OR 97030
North Central NeighborhoodEstimated Value: $490,000 - $562,910
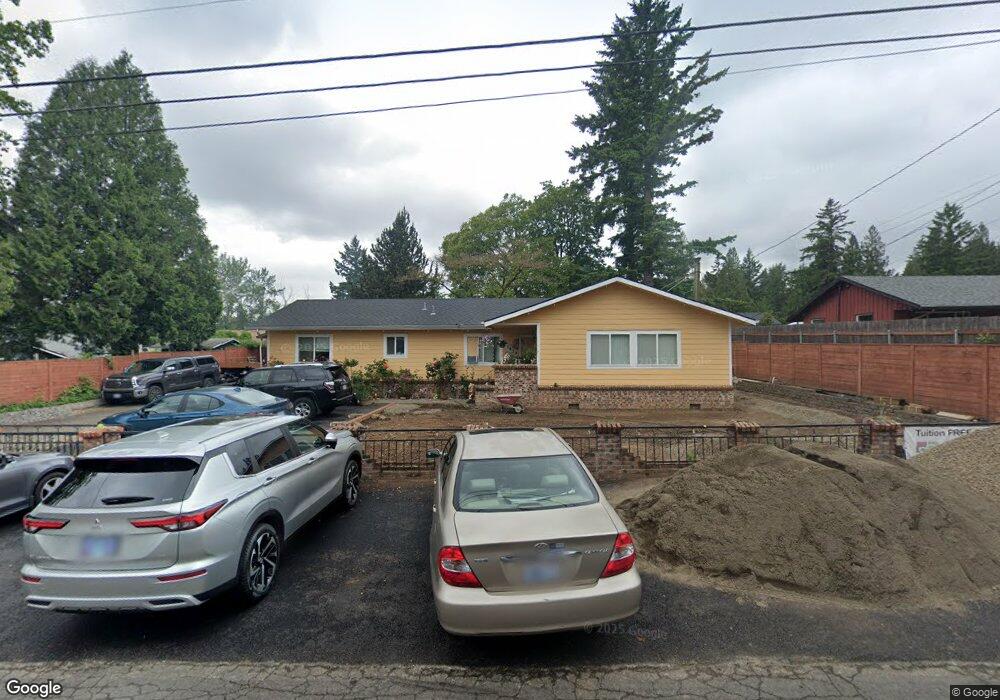
About This Home
This home is located at 21439 SE Ash St, Gresham, OR 97030 and is currently estimated at $529,728, approximately $263 per square foot. 21439 SE Ash St is a home located in Multnomah County with nearby schools including North Gresham Elementary School, Clear Creek Middle School, and Gresham High School.
Ownership History
We collect this data history from publicly available records. To have your information removed, we recommend requesting removal directly through your county’s website.
Purchase Details
Purchase Details
Purchase Details
Home Financials for this Owner
Home Financials are based on the most recent Mortgage that was taken out on this home.Purchase Details
Purchase Details
Home Financials for this Owner
Home Financials are based on the most recent Mortgage that was taken out on this home.Purchase Details
Home Financials for this Owner
Home Financials are based on the most recent Mortgage that was taken out on this home.Home Values in the Area
Average Home Value in this Area
Purchase History
We collect this data history from publicly available records. To have your information removed, we recommend requesting removal directly through your county’s website.
| Date | Buyer | Sale Price | Title Company |
|---|---|---|---|
| $278,132 | Lawyers Title Of Oregon Llc | ||
| -- | Accommodation | ||
| $303,600 | Transnation Title Agency Or | ||
| -- | -- | ||
| $151,000 | Ticor Title Insurance | ||
| -- | Transnation Title Insurance |
Mortgage History
We collect this data history from publicly available records. To have your information removed, we recommend requesting removal directly through your county’s website.
| Date | Status | Borrower | Loan Amount |
|---|---|---|---|
| Previous Owner | $242,880 | ||
| Previous Owner | $120,800 | ||
| Previous Owner | $131,250 |
Tax History
We collect this data history from publicly available records. To have your information removed, we recommend requesting removal directly through your county’s website.
| Year | Tax Paid | Tax Assessment Tax Assessment Total Assessment is a certain percentage of the fair market value that is determined by local assessors to be the total taxable value of land and additions on the property. | Land | Improvement |
|---|---|---|---|---|
| 2025 | $6,695 | $328,990 | -- | -- |
| 2024 | $6,409 | $319,410 | -- | -- |
| 2023 | $5,839 | $310,110 | $0 | $0 |
| 2022 | $5,675 | $301,080 | $0 | $0 |
| 2021 | $5,533 | $292,320 | $0 | $0 |
| 2020 | $5,206 | $283,810 | $0 | $0 |
| 2019 | $5,069 | $275,550 | $0 | $0 |
| 2018 | $4,834 | $267,530 | $0 | $0 |
| 2017 | $4,638 | $259,740 | $0 | $0 |
| 2016 | $4,089 | $252,180 | $0 | $0 |
| 2015 | $4,001 | $244,840 | $0 | $0 |
| 2014 | $3,887 | $237,710 | $0 | $0 |
Map
- 21553 SE Ankeny Terrace
- 21525 SE Oak St
- 21260 SE Stark St
- 21532 SE Alder St
- 21016 SE Stark St Unit 71
- 21016 SE Stark St Unit 69
- 1211 SE 212th Ave
- 75 SE 205th Place
- 581 SE 204th Place
- 1230 SE 214th Ave
- 1207 SE 217th Ave
- 2356 NW Ava Ave
- 2243 NW Norman Ave
- 1035 SE 225th Ave
- 1305 NE Village St
- 2013 NW Bella Vista Dr
- 22106 NE Park Ln
- 1405 NE Village St
- 0 NE 202nd Ave
- 1367 NE Market Dr
- 130 SE 214th Ave
- 21408 SE Ankeny St
- 21455 SE Ash St
- 21436 SE Ash St
- 139 SE 215th Way
- 127 SE 215th Way
- 149 SE 215th Way
- 21414 SE Ankeny St
- 135 SE 215th Way
- 21414 SE Ankeny Bom
- 210 SE 214th Ave
- 109 SE 215th Way
- 21432 SE Ankeny St
- 21450 SE Ash St
- 110 SE 214th Ave
- 117 SE 215th Way
- 21442 SE Ash St
- 21466 SE Ash St
- 21504 SE Ankeny Terrace
- 147 SE 215th Way
Ask me questions while you tour the home.