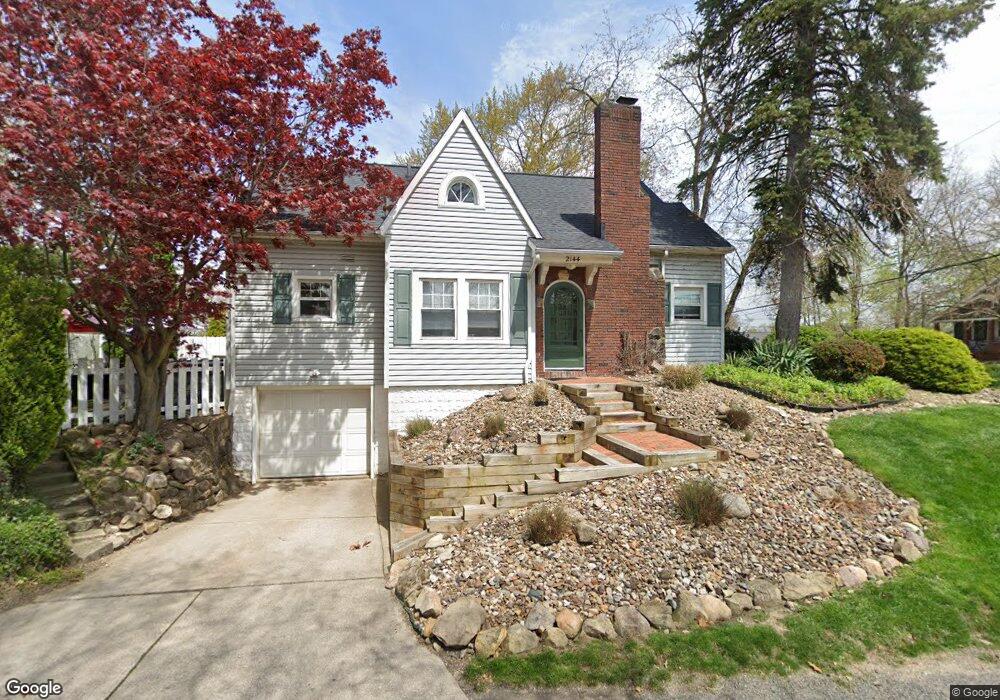
2144 9th St Cuyahoga Falls, OH 44221
Phelps Avenue NeighborhoodEstimated Value: $193,390 - $216,000
2
Beds
2
Baths
940
Sq Ft
$218/Sq Ft
Est. Value
About This Home
This home is located at 2144 9th St, Cuyahoga Falls, OH 44221 and is currently estimated at $205,348, approximately $218 per square foot. 2144 9th St is a home located in Summit County with nearby schools including Dewitt Elementary School, Bolich Middle School, and Cuyahoga Falls High School.
Ownership History
Date
Name
Owned For
Owner Type
Purchase Details
Closed on
Jun 22, 2005
Sold by
Sot David and Sot Angela R
Bought by
Boyes Amy S
Current Estimated Value
Home Financials for this Owner
Home Financials are based on the most recent Mortgage that was taken out on this home.
Original Mortgage
$115,900
Outstanding Balance
$59,491
Interest Rate
5.5%
Mortgage Type
Fannie Mae Freddie Mac
Estimated Equity
$145,857
Purchase Details
Closed on
Jul 15, 1999
Sold by
Krupp Lorie Anne
Bought by
Sot David J and Brumbaugh Angela R
Home Financials for this Owner
Home Financials are based on the most recent Mortgage that was taken out on this home.
Original Mortgage
$120,000
Interest Rate
7.69%
Create a Home Valuation Report for This Property
The Home Valuation Report is an in-depth analysis detailing your home's value as well as a comparison with similar homes in the area
Home Values in the Area
Average Home Value in this Area
Purchase History
| Date | Buyer | Sale Price | Title Company |
|---|---|---|---|
| Boyes Amy S | $144,900 | Chicago Title Insurance Comp | |
| Sot David J | $132,500 | Cathoor Title Agency Inc |
Source: Public Records
Mortgage History
| Date | Status | Borrower | Loan Amount |
|---|---|---|---|
| Open | Boyes Amy S | $115,900 | |
| Previous Owner | Sot David J | $120,000 | |
| Closed | Boyes Amy S | $29,000 |
Source: Public Records
Tax History Compared to Growth
Tax History
| Year | Tax Paid | Tax Assessment Tax Assessment Total Assessment is a certain percentage of the fair market value that is determined by local assessors to be the total taxable value of land and additions on the property. | Land | Improvement |
|---|---|---|---|---|
| 2025 | $2,731 | $50,572 | $9,377 | $41,195 |
| 2024 | $2,731 | $50,572 | $9,377 | $41,195 |
| 2023 | $2,731 | $50,572 | $9,377 | $41,195 |
| 2022 | $2,777 | $41,794 | $7,749 | $34,045 |
| 2021 | $2,777 | $41,794 | $7,749 | $34,045 |
| 2020 | $2,732 | $41,800 | $7,750 | $34,050 |
| 2019 | $3,718 | $51,800 | $7,590 | $44,210 |
| 2018 | $3,157 | $51,800 | $7,590 | $44,210 |
| 2017 | $2,845 | $51,800 | $7,590 | $44,210 |
| 2016 | $2,847 | $47,300 | $7,590 | $39,710 |
| 2015 | $2,845 | $47,300 | $7,590 | $39,710 |
| 2014 | $2,846 | $47,300 | $7,590 | $39,710 |
| 2013 | $2,822 | $47,300 | $7,590 | $39,710 |
Source: Public Records
Map
Nearby Homes