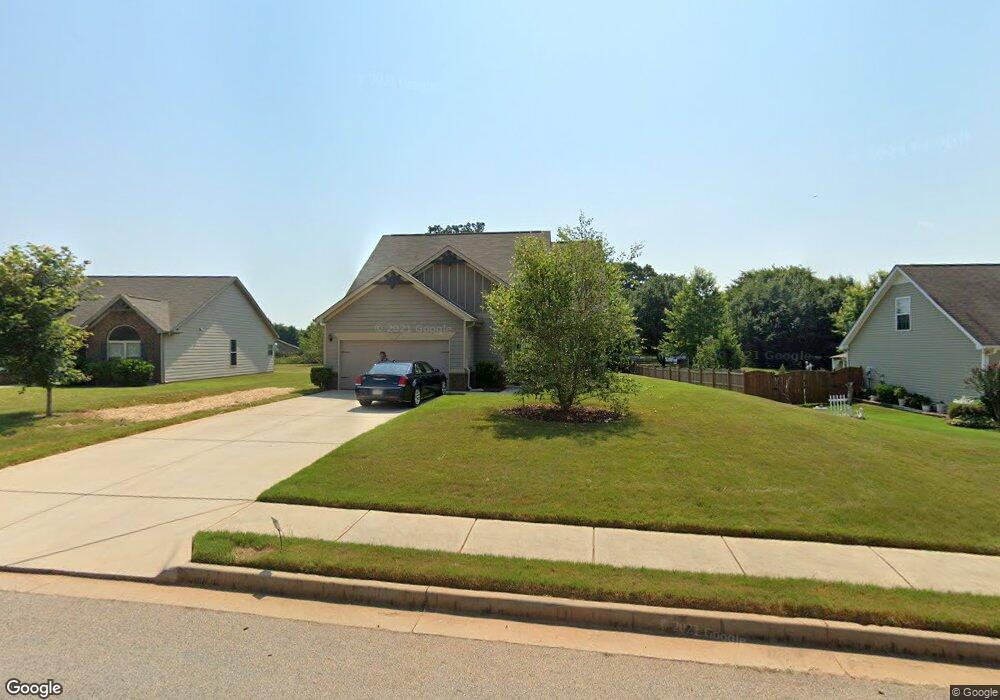
2144 Grant Ave Unit 213 McDonough, GA 30252
Estimated Value: $328,000 - $342,792
4
Beds
3
Baths
2,190
Sq Ft
$154/Sq Ft
Est. Value
About This Home
This home is located at 2144 Grant Ave Unit 213, McDonough, GA 30252 and is currently estimated at $336,448, approximately $153 per square foot. 2144 Grant Ave Unit 213 is a home located in Henry County with nearby schools including Tussahaw Elementary School, Locust Grove Middle School, and Locust Grove High School.
Ownership History
Date
Name
Owned For
Owner Type
Purchase Details
Closed on
Dec 2, 2016
Sold by
Heritage Const & Dev Llc
Bought by
Mcmillian Ceporia L
Current Estimated Value
Home Financials for this Owner
Home Financials are based on the most recent Mortgage that was taken out on this home.
Original Mortgage
$168,874
Outstanding Balance
$138,486
Interest Rate
4.12%
Mortgage Type
FHA
Estimated Equity
$197,962
Purchase Details
Closed on
Mar 26, 2013
Sold by
Heritage Bank
Bought by
Heritage Property Holdings Llc
Home Financials for this Owner
Home Financials are based on the most recent Mortgage that was taken out on this home.
Original Mortgage
$299,200
Interest Rate
3.52%
Mortgage Type
New Conventional
Purchase Details
Closed on
Jan 5, 2010
Sold by
Anchorage Homes Llc
Bought by
Heritage Bk
Create a Home Valuation Report for This Property
The Home Valuation Report is an in-depth analysis detailing your home's value as well as a comparison with similar homes in the area
Home Values in the Area
Average Home Value in this Area
Purchase History
| Date | Buyer | Sale Price | Title Company |
|---|---|---|---|
| Mcmillian Ceporia L | $171,990 | -- | |
| Heritage Property Holdings Llc | $374,000 | -- | |
| Heritage Bk | $38,500 | -- |
Source: Public Records
Mortgage History
| Date | Status | Borrower | Loan Amount |
|---|---|---|---|
| Open | Mcmillian Ceporia L | $168,874 | |
| Previous Owner | Heritage Property Holdings Llc | $299,200 |
Source: Public Records
Tax History Compared to Growth
Tax History
| Year | Tax Paid | Tax Assessment Tax Assessment Total Assessment is a certain percentage of the fair market value that is determined by local assessors to be the total taxable value of land and additions on the property. | Land | Improvement |
|---|---|---|---|---|
| 2025 | $3,860 | $136,120 | $18,000 | $118,120 |
| 2024 | $3,860 | $130,280 | $18,000 | $112,280 |
| 2023 | $3,243 | $127,080 | $16,000 | $111,080 |
| 2022 | $3,214 | $104,480 | $16,000 | $88,480 |
| 2021 | $2,693 | $82,400 | $16,000 | $66,400 |
| 2020 | $2,587 | $77,920 | $12,000 | $65,920 |
| 2019 | $2,404 | $70,160 | $12,000 | $58,160 |
| 2018 | $2,329 | $67,000 | $12,000 | $55,000 |
| 2016 | $2,472 | $62,400 | $8,800 | $53,600 |
| 2015 | $2,267 | $55,320 | $8,800 | $46,520 |
| 2014 | $311 | $6,800 | $6,800 | $0 |
Source: Public Records
Map
Nearby Homes
- 3305 Hancock Point
- 5009 Yankee Doodle Dr
- 3227 Puritan Way
- 5120 Redcoat Ln
- 167 Classica Dr
- 8008 Revere Dr Unit 1
- 9054 Dawes Crossing
- 75 Price Dr W
- 390 Coan Dr
- 435 Rabbit Run
- 1579 S Bethany Rd
- 0 King Mill Rd Unit 10647914
- 0 King Mill Rd Unit 7684355
- 560 Coan Dr
- 308 Jade Laurel Ln
- 104 Waratah Dr
- 340 Colvin Dr
- 825 S Bethany Rd
- 201 Nina Cir
- 2144 Grant Ave
- 2142 Grant Ave
- 2146 Grant Ave Unit 214
- 2146 Grant Ave
- 2148 Grant Ave
- 3108 Delaware Loop Unit 211
- 3108 Delaware Loop
- 2145 Grant Ave Unit 325
- 2143 Grant Ave
- 3308 Hancock Point
- 3308 Hancock Pointe
- 2147 Grant Ave Unit 324
- 3306 Hancock Point
- 2150 Grant Ave
- 2141 Grant Ave
- 2141 Grant Ave Unit 327
- 2141 Grant Ave
- 1636 Iris Lake Rd
- 3106 Delaware Loop
- 2149 Grant Ave Unit 323