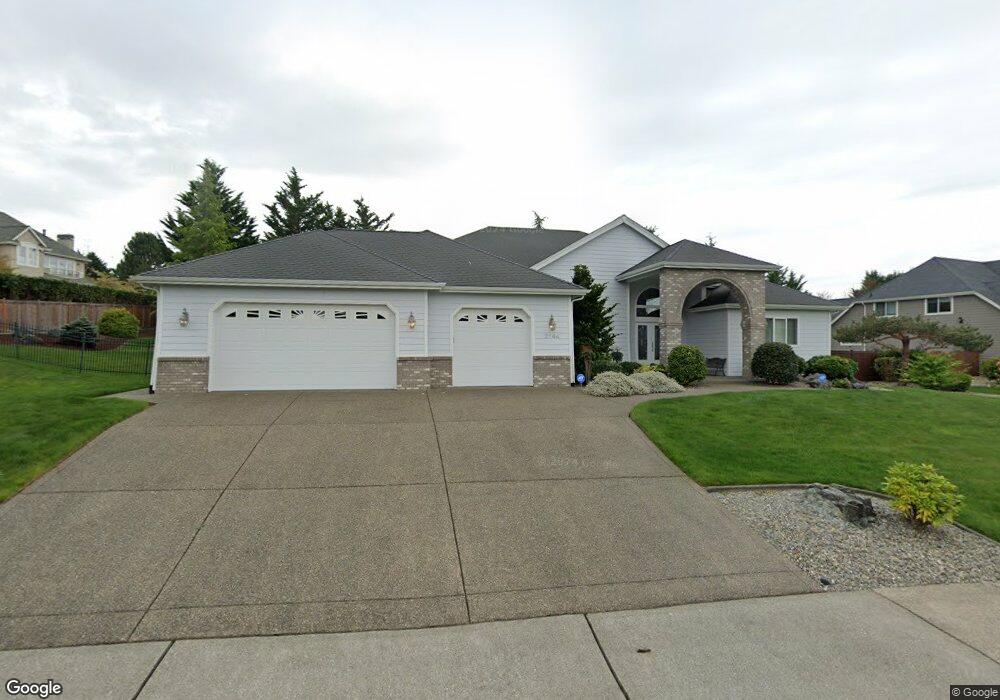
2144 Huntington Loop SE Olympia, WA 98513
The Seasons NeighborhoodEstimated Value: $890,890 - $944,000
4
Beds
3
Baths
2,882
Sq Ft
$316/Sq Ft
Est. Value
About This Home
This home is located at 2144 Huntington Loop SE, Olympia, WA 98513 and is currently estimated at $910,473, approximately $315 per square foot. 2144 Huntington Loop SE is a home located in Thurston County with nearby schools including Evergreen Forest Elementary School, Nisqually Middle School, and River Ridge High School.
Ownership History
Date
Name
Owned For
Owner Type
Purchase Details
Closed on
Nov 14, 2023
Sold by
Payne Beverly Grace
Bought by
Cromwell Trust and Cromwell
Current Estimated Value
Purchase Details
Closed on
Nov 13, 2007
Sold by
Estate Of Robert W Payne
Bought by
Payne B Grace
Purchase Details
Closed on
Aug 15, 2003
Sold by
Oatfield Richard and Oatfield Floella
Bought by
Payne Robert Wilson and Payne Beverly Grace
Purchase Details
Closed on
May 21, 2001
Sold by
Wahldieck Wilma H
Bought by
Oatfield Richard and Oatfield Floella
Purchase Details
Closed on
Oct 24, 2000
Sold by
Mcallister Park Associates Llc
Bought by
Oatfield Richard and Oatfield Floella
Home Financials for this Owner
Home Financials are based on the most recent Mortgage that was taken out on this home.
Original Mortgage
$45,000
Interest Rate
9.5%
Mortgage Type
Seller Take Back
Create a Home Valuation Report for This Property
The Home Valuation Report is an in-depth analysis detailing your home's value as well as a comparison with similar homes in the area
Home Values in the Area
Average Home Value in this Area
Purchase History
| Date | Buyer | Sale Price | Title Company |
|---|---|---|---|
| Cromwell Trust | $800,000 | Chicago Title | |
| Payne B Grace | -- | None Available | |
| Payne Robert Wilson | -- | Transnation Title Insur | |
| Oatfield Richard | -- | Transnation Title Insuran | |
| Wahldieck Wilma H | $50,000 | Transnation Title Insurance | |
| Oatfield Richard | $50,000 | Transnation Title Insurance |
Source: Public Records
Mortgage History
| Date | Status | Borrower | Loan Amount |
|---|---|---|---|
| Previous Owner | Oatfield Richard | $45,000 |
Source: Public Records
Tax History Compared to Growth
Tax History
| Year | Tax Paid | Tax Assessment Tax Assessment Total Assessment is a certain percentage of the fair market value that is determined by local assessors to be the total taxable value of land and additions on the property. | Land | Improvement |
|---|---|---|---|---|
| 2024 | $8,200 | $872,100 | $263,300 | $608,800 |
| 2023 | $8,200 | $848,300 | $265,100 | $583,200 |
| 2022 | $8,377 | $819,000 | $160,200 | $658,800 |
| 2021 | $7,532 | $711,000 | $146,200 | $564,800 |
| 2020 | $6,989 | $595,600 | $131,600 | $464,000 |
| 2019 | $6,132 | $568,900 | $131,100 | $437,800 |
| 2018 | $7,078 | $514,700 | $104,000 | $410,700 |
| 2017 | $6,475 | $490,600 | $87,800 | $402,800 |
| 2016 | $6,193 | $446,800 | $99,200 | $347,600 |
| 2014 | -- | $460,500 | $94,700 | $365,800 |
Source: Public Records
Map
Nearby Homes
- 9032 22nd Way SE
- 2131 Huntington Loop SE
- 9148 Bedington Dr SE
- 2532 Acer Loop SE
- 2530 Acer Loop SE
- 2526 Acer Loop SE
- 8705 Fenwick Loop SE
- 2524 Acer Loop SE
- 2538 Acer Loop SE
- 8711 Fenwick Loop SE
- 2541 Acer Loop SE
- 9245 Nootka Ct SE
- 2635 Acer Loop SE
- 2631 Acer Loop SE
- 2617 Acer Loop SE
- 2612 Acer SE
- 2626 Acer Loop SE
- 2624 Acer Loop SE
- 1436 Farina Loop SE
- 9440 Piperhill Dr SE
- 2148 Huntington Loop SE
- 9040 22nd Way SE
- 8948 22nd Way SE
- 2149 Huntington Loop SE
- 2137 Huntington Loop SE
- 2143 Huntington Loop SE
- 2204 Huntington Loop SE
- 2120 Huntington Loop SE
- 9125 22nd Way SE
- 2205 Huntington Loop SE
- 2304 Kerrysdale Dr SE
- 9039 22nd Way SE
- 9047 22nd Way SE
- 9049 22nd Way SE
- 2125 Huntington Loop SE
- 8947 22nd Way SE
- 2211 Huntington Loop SE
- 9128 23rd Way SE
- 8933 22nd Way SE
- 9136 23rd Way SE