Estimated Value: $549,454 - $618,000
3
Beds
3
Baths
2,453
Sq Ft
$238/Sq Ft
Est. Value
About This Home
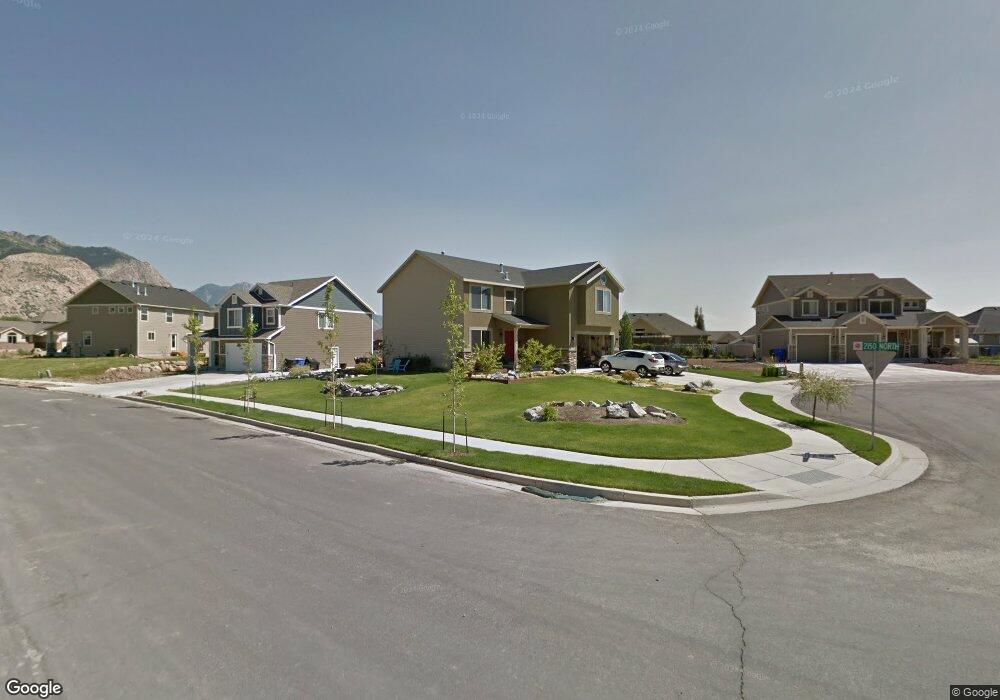
This home is located at 2144 N 200 E, Ogden, UT 84414 and is currently estimated at $583,114, approximately $237 per square foot. 2144 N 200 E is a home located in Weber County with nearby schools including Majestic Elementary School, Orion Junior High School, and Weber High School.
Ownership History
Date
Name
Owned For
Owner Type
Purchase Details
Closed on
Jul 9, 2020
Sold by
Zulliger Eric
Bought by
Bosley Holly L and Chambers Taylor
Current Estimated Value
Home Financials for this Owner
Home Financials are based on the most recent Mortgage that was taken out on this home.
Original Mortgage
$207,000
Outstanding Balance
$183,894
Interest Rate
3.2%
Mortgage Type
Stand Alone Second
Estimated Equity
$399,220
Purchase Details
Closed on
Jun 19, 2009
Sold by
Fieldstone Homes Utah Llc
Bought by
Zulliger Eric
Home Financials for this Owner
Home Financials are based on the most recent Mortgage that was taken out on this home.
Original Mortgage
$209,646
Interest Rate
4.82%
Mortgage Type
FHA
Create a Home Valuation Report for This Property
The Home Valuation Report is an in-depth analysis detailing your home's value as well as a comparison with similar homes in the area
Home Values in the Area
Average Home Value in this Area
Purchase History
| Date | Buyer | Sale Price | Title Company |
|---|---|---|---|
| Bosley Holly L | -- | Us Title Insurance Agency | |
| Zulliger Eric | -- | Bonneville Superior Title Co |
Source: Public Records
Mortgage History
| Date | Status | Borrower | Loan Amount |
|---|---|---|---|
| Open | Bosley Holly L | $207,000 | |
| Previous Owner | Zulliger Eric | $209,646 |
Source: Public Records
Tax History
| Year | Tax Paid | Tax Assessment Tax Assessment Total Assessment is a certain percentage of the fair market value that is determined by local assessors to be the total taxable value of land and additions on the property. | Land | Improvement |
|---|---|---|---|---|
| 2025 | $3,369 | $504,413 | $177,359 | $327,054 |
| 2024 | $3,333 | $273,899 | $97,547 | $176,352 |
| 2023 | $3,336 | $279,400 | $97,124 | $182,276 |
| 2022 | $3,205 | $276,100 | $80,605 | $195,495 |
| 2021 | $2,695 | $394,000 | $91,387 | $302,613 |
| 2020 | $2,429 | $330,000 | $74,699 | $255,301 |
| 2019 | $2,285 | $297,000 | $69,676 | $227,324 |
| 2018 | $2,199 | $273,000 | $65,533 | $207,467 |
| 2017 | $2,159 | $253,000 | $65,439 | $187,561 |
| 2016 | $2,034 | $127,723 | $31,222 | $96,501 |
| 2015 | $2,034 | $128,079 | $28,422 | $99,657 |
| 2014 | $1,817 | $109,974 | $28,422 | $81,552 |
Source: Public Records
Map
Nearby Homes
- 185 E 2100 N
- 279 E 2150 N
- 2243 N 225 E Unit 64
- 273 E 2050 N
- 225 E 2300 N
- 265 E 1900 N
- 247 E 1850 N Unit 4
- 247 E 1850 N Unit 10
- 247 E 1850 N Unit 2
- 363 E 2300 N
- 285 E 1850 N Unit 45
- 270 E 1825 N Unit 53
- 290 E 1825 N Unit 58
- 263 E 1825 N Unit 79
- 422 E 2050 N Unit 5C
- 1978 N 225 W Unit 72
- 2421 N 400 E Unit C4
- 2421 N 400 E Unit M3
- 2437 Charleston Ave
- 2267 N 225 W
Your Personal Tour Guide
Ask me questions while you tour the home.