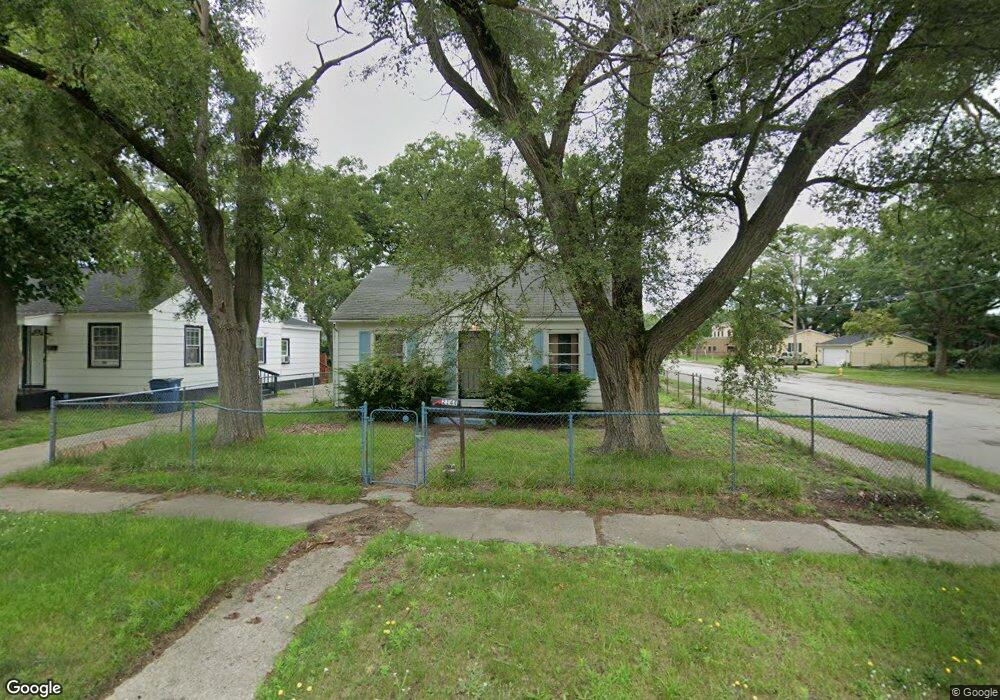
2144 Superior St Muskegon, MI 49444
Estimated Value: $60,000 - $89,000
--
Bed
1
Bath
744
Sq Ft
$106/Sq Ft
Est. Value
About This Home
This home is located at 2144 Superior St, Muskegon, MI 49444 and is currently estimated at $79,225, approximately $106 per square foot. 2144 Superior St is a home located in Muskegon County with nearby schools including Three Oaks Public School Academy, Edgewood Elementary Academy, and Dr. Martin Luther King Academy.
Ownership History
Date
Name
Owned For
Owner Type
Purchase Details
Closed on
May 31, 2023
Sold by
Abundant Life Homes Llc
Bought by
Alhportfolio Llc
Current Estimated Value
Home Financials for this Owner
Home Financials are based on the most recent Mortgage that was taken out on this home.
Original Mortgage
$1,143,000
Outstanding Balance
$1,113,427
Interest Rate
6.57%
Mortgage Type
New Conventional
Estimated Equity
-$1,034,202
Purchase Details
Closed on
Dec 18, 2020
Sold by
Dotson Charles H
Bought by
Rth Investing Llc
Purchase Details
Closed on
Oct 1, 2019
Sold by
County Of Muskegon
Bought by
Dotson Charles H
Create a Home Valuation Report for This Property
The Home Valuation Report is an in-depth analysis detailing your home's value as well as a comparison with similar homes in the area
Home Values in the Area
Average Home Value in this Area
Purchase History
| Date | Buyer | Sale Price | Title Company |
|---|---|---|---|
| Alhportfolio Llc | -- | Star Title Agency | |
| Rth Investing Llc | $20,000 | Star Title Agency Llc | |
| Rth Investing Llc | $20,000 | Star Title Agency | |
| Dotson Charles H | $14,250 | None Available |
Source: Public Records
Mortgage History
| Date | Status | Borrower | Loan Amount |
|---|---|---|---|
| Open | Alhportfolio Llc | $1,143,000 |
Source: Public Records
Tax History Compared to Growth
Tax History
| Year | Tax Paid | Tax Assessment Tax Assessment Total Assessment is a certain percentage of the fair market value that is determined by local assessors to be the total taxable value of land and additions on the property. | Land | Improvement |
|---|---|---|---|---|
| 2025 | $1,149 | $23,200 | $0 | $0 |
| 2024 | $852 | $18,600 | $0 | $0 |
| 2023 | $708 | $13,500 | $0 | $0 |
| 2022 | $870 | $12,800 | $0 | $0 |
| 2021 | $848 | $11,200 | $0 | $0 |
| 2020 | $829 | $10,900 | $0 | $0 |
| 2019 | $811 | $10,700 | $0 | $0 |
| 2018 | $792 | $10,500 | $0 | $0 |
| 2017 | $734 | $10,200 | $0 | $0 |
| 2016 | $514 | $10,500 | $0 | $0 |
| 2015 | -- | $10,800 | $0 | $0 |
| 2014 | -- | $2,000 | $0 | $0 |
| 2013 | -- | $11,800 | $0 | $0 |
Source: Public Records
Map
Nearby Homes