Estimated Value: $383,000 - $426,000
4
Beds
3
Baths
2,560
Sq Ft
$157/Sq Ft
Est. Value
About This Home
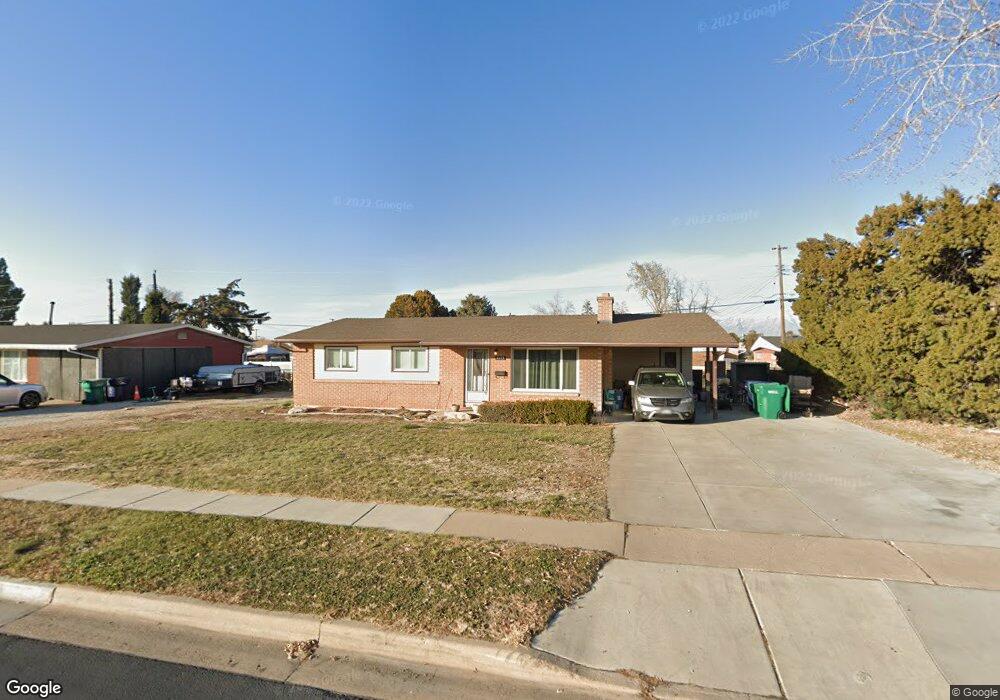
This home is located at 2144 W 4900 S, Roy, UT 84067 and is currently estimated at $402,715, approximately $157 per square foot. 2144 W 4900 S is a home located in Weber County with nearby schools including Lakeview Elementary School, Roy Junior High School, and Roy High School.
Ownership History
Date
Name
Owned For
Owner Type
Purchase Details
Closed on
Mar 10, 2021
Sold by
Thurgood Vaden
Bought by
Panucci Fred and Panucci Betsy V
Current Estimated Value
Purchase Details
Closed on
Mar 8, 2021
Sold by
Panucci Fred and Panucci Betsy V
Bought by
Panucci Fred and Panucci Betsy V
Purchase Details
Closed on
Dec 8, 2016
Bought by
Panucci Fred
Home Financials for this Owner
Home Financials are based on the most recent Mortgage that was taken out on this home.
Original Mortgage
$55,061
Interest Rate
4.13%
Purchase Details
Closed on
Nov 1, 2013
Sold by
Panucci Betsy V and Thurgood Betsy V
Bought by
Panucci Betsy and Thurgood Vaden
Create a Home Valuation Report for This Property
The Home Valuation Report is an in-depth analysis detailing your home's value as well as a comparison with similar homes in the area
Home Values in the Area
Average Home Value in this Area
Purchase History
We collect this data history from publicly available records. To have your information removed, we recommend requesting removal directly through your county’s website.
| Date | Buyer | Sale Price | Title Company |
|---|---|---|---|
| Panucci Fred | -- | Accommodation | |
| Panucci Fred | -- | Us Title Insurance Agency | |
| Panucci Fred | -- | -- | |
| Panucci Betsy | -- | Inwest Title Ogden |
Source: Public Records
Mortgage History
We collect this data history from publicly available records. To have your information removed, we recommend requesting removal directly through your county’s website.
| Date | Status | Borrower | Loan Amount |
|---|---|---|---|
| Previous Owner | Panucci Fred | $55,061 | |
| Previous Owner | Panucci Fred | -- |
Source: Public Records
Tax History
| Year | Tax Paid | Tax Assessment Tax Assessment Total Assessment is a certain percentage of the fair market value that is determined by local assessors to be the total taxable value of land and additions on the property. | Land | Improvement |
|---|---|---|---|---|
| 2025 | $2,494 | $393,235 | $118,613 | $274,622 |
| 2024 | $2,369 | $375,000 | $118,614 | $256,386 |
| 2023 | $2,341 | $372,000 | $113,778 | $258,222 |
| 2022 | $2,567 | $424,000 | $104,152 | $319,848 |
| 2021 | $1,968 | $291,000 | $69,380 | $221,620 |
| 2020 | $1,881 | $256,000 | $69,380 | $186,620 |
| 2019 | $1,827 | $234,000 | $39,503 | $194,497 |
| 2018 | $1,670 | $200,000 | $36,539 | $163,461 |
| 2017 | $1,557 | $174,000 | $36,539 | $137,461 |
| 2016 | $1,445 | $86,332 | $18,871 | $67,461 |
| 2015 | $1,335 | $81,367 | $18,871 | $62,496 |
| 2014 | $1,342 | $81,037 | $16,015 | $65,022 |
Source: Public Records
Map
Nearby Homes
- 2167 W 4950 S
- 2045 W 5025 S
- 5089 S 2325 W
- 4827 S 1800 W Unit 32
- 1865 W 5050 S
- 5185 S 2100 W
- 2427 W 5025 S
- 2402 W 5075 S
- 1838 W 5050 S
- 1814 W 5050 S
- 1805 W 5050 S
- 5174 S 1900 W
- 5243 S 2200 W
- 1789 W 5050 S
- 5261 S 2200 W
- 1781 W 5050 S
- 5256 S 2000 W
- 283 3800 S 1900 W #283 Unit 283
- 4539 S 1800 W Unit 127
- 4621 Wedgewood Dr
Your Personal Tour Guide
Ask me questions while you tour the home.