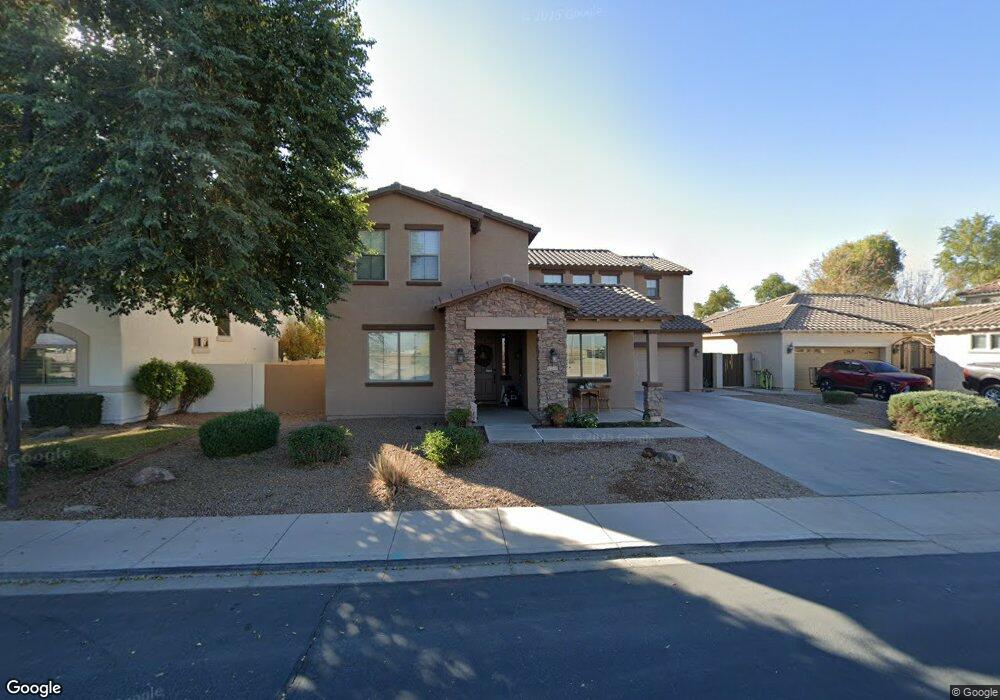
21445 E Lords Way Queen Creek, AZ 85142
Estimated Value: $565,516 - $844,000
6
Beds
5
Baths
3,441
Sq Ft
$205/Sq Ft
Est. Value
About This Home
This home is located at 21445 E Lords Way, Queen Creek, AZ 85142 and is currently estimated at $705,379, approximately $204 per square foot. 21445 E Lords Way is a home located in Maricopa County with nearby schools including Jack Barnes Elementary School, Queen Creek Junior High School, and Benjamin Franklin Charter School - Crismon.
Ownership History
Date
Name
Owned For
Owner Type
Purchase Details
Closed on
Jan 27, 2011
Sold by
Bilski Brad
Bought by
Moore Russell W and Moore Gayle A
Current Estimated Value
Home Financials for this Owner
Home Financials are based on the most recent Mortgage that was taken out on this home.
Original Mortgage
$228,944
Outstanding Balance
$161,907
Interest Rate
5.5%
Mortgage Type
FHA
Estimated Equity
$543,472
Purchase Details
Closed on
Sep 11, 2006
Sold by
Bilski Amber Gail
Bought by
Bilski Brad
Home Financials for this Owner
Home Financials are based on the most recent Mortgage that was taken out on this home.
Original Mortgage
$165,000
Interest Rate
6.51%
Mortgage Type
Purchase Money Mortgage
Create a Home Valuation Report for This Property
The Home Valuation Report is an in-depth analysis detailing your home's value as well as a comparison with similar homes in the area
Home Values in the Area
Average Home Value in this Area
Purchase History
| Date | Buyer | Sale Price | Title Company |
|---|---|---|---|
| Moore Russell W | $234,900 | First American Title Ins Co | |
| Bilski Brad | -- | Fidelity National Title | |
| Bilski Brad | $304,926 | Fidelity National Title |
Source: Public Records
Mortgage History
| Date | Status | Borrower | Loan Amount |
|---|---|---|---|
| Open | Moore Russell W | $228,944 | |
| Previous Owner | Bilski Brad | $165,000 |
Source: Public Records
Tax History Compared to Growth
Tax History
| Year | Tax Paid | Tax Assessment Tax Assessment Total Assessment is a certain percentage of the fair market value that is determined by local assessors to be the total taxable value of land and additions on the property. | Land | Improvement |
|---|---|---|---|---|
| 2025 | $2,780 | $30,422 | -- | -- |
| 2024 | $2,849 | $28,973 | -- | -- |
| 2023 | $2,849 | $43,210 | $8,640 | $34,570 |
| 2022 | $2,767 | $33,450 | $6,690 | $26,760 |
| 2021 | $2,825 | $30,530 | $6,100 | $24,430 |
| 2020 | $2,735 | $28,170 | $5,630 | $22,540 |
| 2019 | $2,712 | $25,900 | $5,180 | $20,720 |
| 2018 | $2,723 | $24,170 | $4,830 | $19,340 |
| 2017 | $2,657 | $22,810 | $4,560 | $18,250 |
| 2016 | $2,591 | $22,420 | $4,480 | $17,940 |
| 2015 | $2,134 | $22,200 | $4,440 | $17,760 |
Source: Public Records
Map
Nearby Homes
- 21469 E Roundup Way
- 21471 E Saddle Ct
- 20516 S 216th Place
- 20534 S 216th Place
- 21503 E North Ct
- 20552 S 216th Place
- 20624 S 216th Place
- 21640 E Roundup Way
- 21658 E Lords Way
- 21402 E Alyssa Rd
- Prato Plan at Jorde Farms - Cactus Series
- Barletta Plan at Jorde Farms - Cactus Series
- Casoria Plan at Jorde Farms - Cactus Series
- Avelino Plan at Jorde Farms - Cactus Series
- Pearce Plan at Light Sky Ranch
- Pomona Plan at Light Sky Ranch
- Pinecrest Plan at Light Sky Ranch
- 21192 E Stirrup St
- 21168 E Saddle Way
- 20696 S 216th Place
- 21453 E Lords Way
- 21437 E Lords Way
- 21444 E Roundup Way
- 21436 E Roundup Way
- 21452 E Roundup Way
- 21461 E Lords Way
- 21429 E Lords Way
- 21460 E Roundup Way
- 21428 E Roundup Way
- 21436 E Lords Way
- 21469 E Lords Way
- 21421 E Lords Way
- 21428 E Lords Way
- 21466 E Roundup Way
- 21420 E Roundup Way
- 21477 E Lords Way
- 21413 E Lords Way
- 21420 E Lords Way
- 21445 E Roundup Way
- 21437 E Roundup Way