Estimated Value: $72,000 - $113,000
3
Beds
2
Baths
2,024
Sq Ft
$48/Sq Ft
Est. Value
About This Home
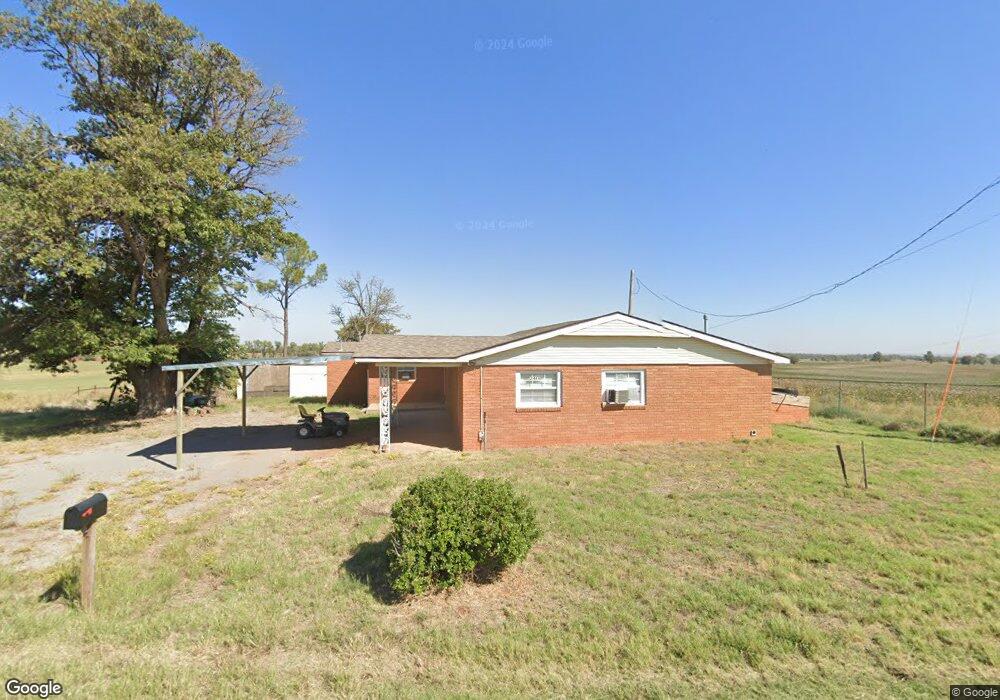
This home is located at 21449 E 1150 Rd, Foss, OK 73647 and is currently estimated at $97,298, approximately $48 per square foot. 21449 E 1150 Rd is a home with nearby schools including Will Rogers Elementary School and Burns Flat-Dill City High School.
Ownership History
Date
Name
Owned For
Owner Type
Purchase Details
Closed on
Nov 7, 2025
Sold by
Farmers Cooperative Exchange
Bought by
Lonestar Gin Lp
Current Estimated Value
Home Financials for this Owner
Home Financials are based on the most recent Mortgage that was taken out on this home.
Original Mortgage
$445,300
Outstanding Balance
$445,300
Interest Rate
6.3%
Mortgage Type
Credit Line Revolving
Estimated Equity
-$348,002
Purchase Details
Closed on
Nov 3, 2021
Sold by
Cynthia Short
Bought by
Gong Weiqing
Purchase Details
Closed on
Jul 5, 2017
Sold by
Fournier Arthur P and Fournier Patricia Jc
Bought by
Short Cynthia
Purchase Details
Closed on
Sep 3, 2003
Sold by
C & C Investment Liv/Trst
Bought by
Fournier Arthur P
Purchase Details
Closed on
Nov 8, 2000
Sold by
Wilhelm Henry
Bought by
C & C Investment Liv/Trst
Purchase Details
Closed on
Sep 14, 2000
Sold by
Wilhelm Arlyne E
Bought by
Wilhelm Henry
Create a Home Valuation Report for This Property
The Home Valuation Report is an in-depth analysis detailing your home's value as well as a comparison with similar homes in the area
Home Values in the Area
Average Home Value in this Area
Purchase History
| Date | Buyer | Sale Price | Title Company |
|---|---|---|---|
| Lonestar Gin Lp | $3,000 | Atlas Title | |
| Gong Weiqing | $20,000 | None Listed On Document | |
| Short Cynthia | $20,000 | None Available | |
| Fournier Arthur P | $40,000 | -- | |
| C & C Investment Liv/Trst | $20,000 | -- | |
| Wilhelm Henry | -- | -- |
Source: Public Records
Mortgage History
| Date | Status | Borrower | Loan Amount |
|---|---|---|---|
| Open | Lonestar Gin Lp | $445,300 |
Source: Public Records
Tax History Compared to Growth
Tax History
| Year | Tax Paid | Tax Assessment Tax Assessment Total Assessment is a certain percentage of the fair market value that is determined by local assessors to be the total taxable value of land and additions on the property. | Land | Improvement |
|---|---|---|---|---|
| 2025 | $210 | $2,948 | $256 | $2,692 |
| 2024 | $210 | $2,808 | $244 | $2,564 |
| 2023 | $199 | $2,674 | $242 | $2,432 |
| 2022 | $206 | $2,547 | $240 | $2,307 |
| 2021 | $193 | $2,426 | $238 | $2,188 |
| 2020 | $184 | $2,310 | $238 | $2,072 |
| 2019 | $173 | $2,201 | $238 | $1,963 |
| 2018 | $175 | $2,201 | $238 | $1,963 |
| 2017 | $413 | $5,160 | $191 | $4,969 |
| 2016 | $315 | $4,914 | $182 | $4,732 |
| 2015 | $299 | $4,770 | $182 | $4,588 |
| 2014 | $299 | $4,632 | $180 | $4,452 |
Source: Public Records
Map
Nearby Homes
- 21238 Highway 73
- 412 Cherokee Trail Unit B
- 107 Cimarron Rd
- 207 Pioneer Way
- 306 Potomac Rd
- 204 Elaine Dr
- 0 I-40 Frontage Road 26 Acres
- 0 I-40 Frontage 37 Acres
- 0 Clinton Lake Road 38 Acres Rd Unit 1194486
- 409 W 5th St
- 114 N Rambo
- 101 Claude St
- 21508 S Frontage Rd
- 409 S McDonald St
- 705 S 6th St
- 11117 N 2073 Rd
- 12004 N 2110 Rd
- 105 E Walk
- 0 E 1220 Rd
- 10579 3151
- 11451 N 2100 Rd
- 21308 E 989 Rd
- 21257 E 1050 Rd
- 21553 Highway 73
- 10245 N 2120 Rd
- 10294 N 2140 Rd
- 21289 E 990 Rd
- 10254 N 2120 Rd
- 10633 N 2180 Rd
- 21228 Highway 73
- 21249 E 990 Rd
- 21251 E 990 Rd
- 21293 E 990 Rd
- 10465 N 2120 Rd
- 21257 E 990 Rd
- 21259 E 990 Rd
- 21248 Highway 73
- 21302 E 989 Rd
- 10626 N 2180 Rd
- 10630 N 2180 Rd