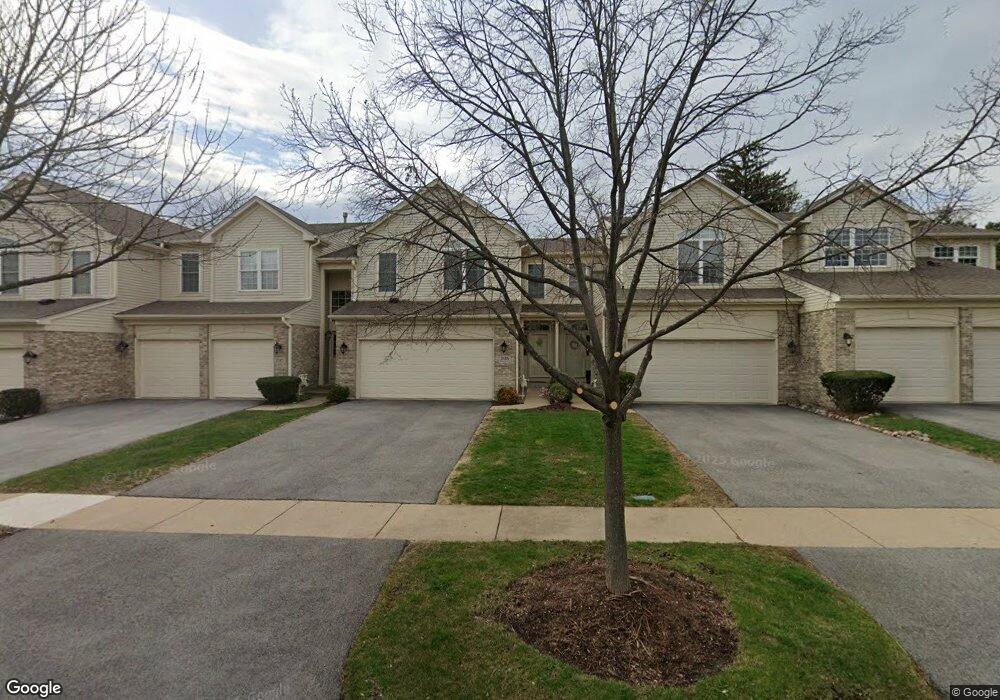
2145 Ashley Ct Downers Grove, IL 60515
Estimated Value: $425,859 - $501,000
--
Bed
1
Bath
1,620
Sq Ft
$286/Sq Ft
Est. Value
About This Home
This home is located at 2145 Ashley Ct, Downers Grove, IL 60515 and is currently estimated at $463,215, approximately $285 per square foot. 2145 Ashley Ct is a home located in DuPage County with nearby schools including Henry Puffer School, Herrick Middle School, and Downer Grove North High School.
Ownership History
Date
Name
Owned For
Owner Type
Purchase Details
Closed on
Apr 12, 2012
Sold by
Jarmoc Max E and Jarmoc Linda A
Bought by
Jarmoc Linda A and Linda A Jarmoc Trust
Current Estimated Value
Purchase Details
Closed on
Jun 10, 2005
Sold by
Mance James L and Mance Sandra S
Bought by
Jarmoc Max E and Jarmoc Linda A
Home Financials for this Owner
Home Financials are based on the most recent Mortgage that was taken out on this home.
Original Mortgage
$300,000
Outstanding Balance
$159,030
Interest Rate
6%
Mortgage Type
New Conventional
Estimated Equity
$304,185
Purchase Details
Closed on
Aug 5, 2003
Sold by
Mance James L and Mance Sandra S
Bought by
Mance James L and Mance Sandra S
Purchase Details
Closed on
Feb 15, 2000
Sold by
Harris Bank Hinsdale
Bought by
Mance James L and Mance Sandra S
Home Financials for this Owner
Home Financials are based on the most recent Mortgage that was taken out on this home.
Original Mortgage
$100,000
Interest Rate
8.21%
Mortgage Type
Purchase Money Mortgage
Create a Home Valuation Report for This Property
The Home Valuation Report is an in-depth analysis detailing your home's value as well as a comparison with similar homes in the area
Home Values in the Area
Average Home Value in this Area
Purchase History
| Date | Buyer | Sale Price | Title Company |
|---|---|---|---|
| Jarmoc Linda A | -- | None Available | |
| Jarmoc Max E | $340,500 | Ticor Title | |
| Mance James L | -- | -- | |
| Mance James L | $207,000 | Chicago Title Insurance Co |
Source: Public Records
Mortgage History
| Date | Status | Borrower | Loan Amount |
|---|---|---|---|
| Open | Jarmoc Max E | $300,000 | |
| Previous Owner | Mance James L | $100,000 |
Source: Public Records
Tax History Compared to Growth
Tax History
| Year | Tax Paid | Tax Assessment Tax Assessment Total Assessment is a certain percentage of the fair market value that is determined by local assessors to be the total taxable value of land and additions on the property. | Land | Improvement |
|---|---|---|---|---|
| 2024 | $6,197 | $124,351 | $31,370 | $92,981 |
| 2023 | $5,807 | $113,490 | $28,630 | $84,860 |
| 2022 | $5,654 | $107,070 | $27,010 | $80,060 |
| 2021 | $5,139 | $103,020 | $25,990 | $77,030 |
| 2020 | $5,049 | $101,170 | $25,520 | $75,650 |
| 2019 | $4,861 | $96,800 | $24,420 | $72,380 |
| 2018 | $5,224 | $101,890 | $25,700 | $76,190 |
| 2017 | $5,068 | $98,450 | $24,830 | $73,620 |
| 2016 | $5,003 | $94,890 | $23,930 | $70,960 |
| 2015 | $4,927 | $89,350 | $22,530 | $66,820 |
| 2014 | $5,077 | $89,350 | $22,530 | $66,820 |
| 2013 | $5,012 | $89,560 | $22,580 | $66,980 |
Source: Public Records
Map
Nearby Homes
- 2160 Howard Ave
- 5509 Aspen Ave Unit 6
- 5431 Ashbrook Place Unit 8
- 2335 Old George Way Unit 2335
- 5434 Ashbrook Place
- 5538 Durand Dr
- 5622 Belmont Rd
- 5616 Durand Dr Unit 6D
- 1903 Maple Ave
- 5617 Durand Dr Unit 9A
- 5727 Woodward Ave
- 5454 Lee Ave
- 5760 Woodward Ave
- 5915 Pershing Ave
- 4947 Stonewall Ave
- 2605 Maple Ave
- 2749 College Rd
- 4940 Cornell Ave
- 2800 Maple Ave Unit 31C
- 4939 Lee Ave
- 2147 Ashley Ct
- 2141 Ashley Ct
- 5421 Belmont Rd
- 2139 Ashley Ct
- 2149 Ashley Ct
- 2137 Ashley Ct
- 2135 Ashley Ct
- 2133 Ashley Ct
- 2146 Ashley Ct
- 2148 Ashley Ct
- 2140 Ashley Ct
- 2144 Ashley Ct
- 2152 Howard Ave
- 2142 Ashley Ct
- 2131 Ashley Ct
- 2150 Ashley Ct
- 2138 Ashley Ct
- 2136 Ashley Ct
- 2134 Ashley Ct
- 2127 Ashley Ct