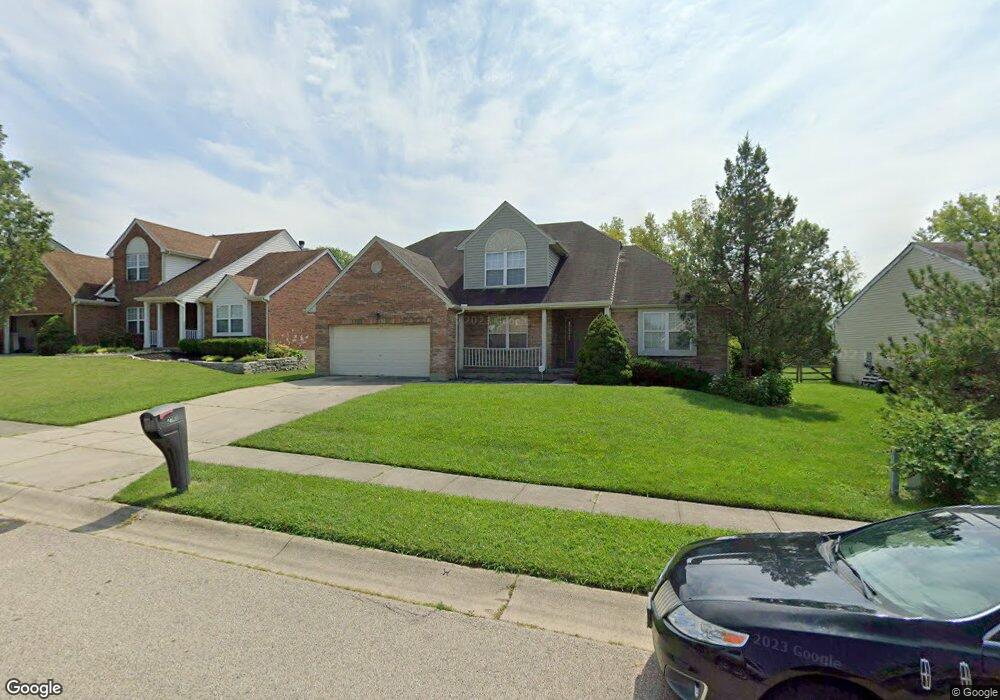
2145 Crest Rd Cincinnati, OH 45240
Estimated Value: $362,000 - $441,000
4
Beds
4
Baths
3,419
Sq Ft
$114/Sq Ft
Est. Value
About This Home
This home is located at 2145 Crest Rd, Cincinnati, OH 45240 and is currently estimated at $390,468, approximately $114 per square foot. 2145 Crest Rd is a home located in Hamilton County with nearby schools including Pleasant Run Elementary School, Pleasant Run Middle School, and Northwest High School.
Ownership History
Date
Name
Owned For
Owner Type
Purchase Details
Closed on
Jul 30, 2004
Sold by
Williams Neal W and Williams Kellie R
Bought by
Peagler Marcus T
Current Estimated Value
Purchase Details
Closed on
Jan 4, 1996
Sold by
Meyer Douglas H and Meyer Sandra L
Bought by
Williams Neal W and Williams Kellie R
Home Financials for this Owner
Home Financials are based on the most recent Mortgage that was taken out on this home.
Original Mortgage
$136,800
Interest Rate
7.19%
Purchase Details
Closed on
Jul 5, 1995
Sold by
Drees Cobblestone Joint Venture
Bought by
Meyer Douglas H and Meyer Sandra L
Create a Home Valuation Report for This Property
The Home Valuation Report is an in-depth analysis detailing your home's value as well as a comparison with similar homes in the area
Home Values in the Area
Average Home Value in this Area
Purchase History
| Date | Buyer | Sale Price | Title Company |
|---|---|---|---|
| Peagler Marcus T | -- | -- | |
| Williams Neal W | -- | -- | |
| Meyer Douglas H | -- | -- |
Source: Public Records
Mortgage History
| Date | Status | Borrower | Loan Amount |
|---|---|---|---|
| Previous Owner | Williams Neal W | $136,800 |
Source: Public Records
Tax History
| Year | Tax Paid | Tax Assessment Tax Assessment Total Assessment is a certain percentage of the fair market value that is determined by local assessors to be the total taxable value of land and additions on the property. | Land | Improvement |
|---|---|---|---|---|
| 2025 | $5,272 | $100,709 | $15,400 | $85,309 |
| 2024 | $5,148 | $100,709 | $15,400 | $85,309 |
| 2023 | $5,177 | $100,709 | $15,400 | $85,309 |
| 2022 | $4,971 | $78,649 | $13,188 | $65,461 |
| 2021 | $4,930 | $78,649 | $13,188 | $65,461 |
| 2020 | $4,979 | $78,649 | $13,188 | $65,461 |
| 2019 | $4,646 | $65,541 | $10,990 | $54,551 |
| 2018 | $4,167 | $65,541 | $10,990 | $54,551 |
| 2017 | $3,950 | $65,541 | $10,990 | $54,551 |
| 2016 | $3,682 | $59,959 | $11,781 | $48,178 |
| 2015 | $3,716 | $59,959 | $11,781 | $48,178 |
| 2014 | $3,377 | $59,959 | $11,781 | $48,178 |
| 2013 | $3,271 | $58,783 | $11,550 | $47,233 |
Source: Public Records
Map
Nearby Homes
- 2171 Rangoon Ct
- 11484 Ravensburg Ct
- 11424 Riga Ct
- 11717 Hamilton Ave
- 11565 Regency Square Ct
- 2465 Owlcrest Dr
- 2017 Broadhurst Ave
- 11586 Pippin Rd
- 11666 Elkwood Dr
- 11835 Wincanton Dr
- 2756 Cranbrook Dr
- 2617 Chesterhill Dr
- 11505 Oxfordshire Ln
- 11995 Wincanton Dr
- 12080 Regency Run Ct Unit 4
- 11440 Mill Rd
- 2891 Greenbrook Ln
- 12120 Regency Run Ct
- 11537 Norbourne Dr
- 11955 Mill Rd
- 2137 Crest Rd
- 2153 Crest Rd
- 2129 Crest Rd
- 2122 Rubicon Place
- 2114 Rubicon Place
- 2130 Rubicon Place
- 2106 Rubicon Place
- 2138 Rubicon Place
- 2146 Crest Rd
- 2138 Crest Rd
- 2130 Crest Rd
- 2121 Crest Rd
- 2122 Crest Rd
- 2098 Rubicon Place
- 2146 Rubicon Place
- 2090 Rubicon Place
- 2113 Crest Rd
- 2114 Crest Rd
- 2154 Rubicon Place
- 2121 Rubicon Place
Your Personal Tour Guide
Ask me questions while you tour the home.