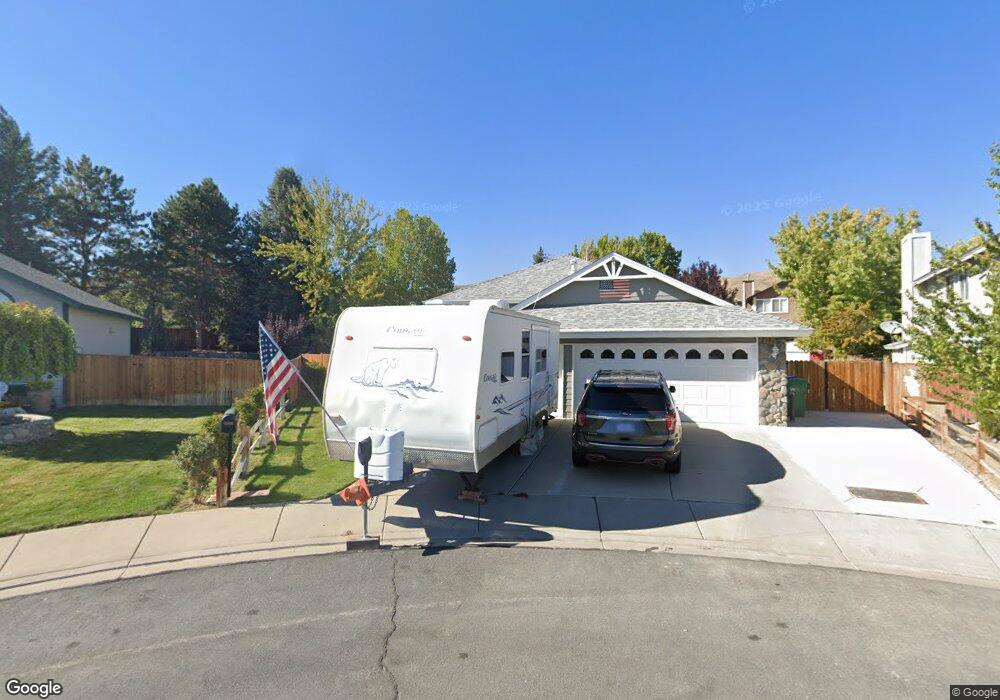
2145 Crown Point Ct Reno, NV 89523
Northgate NeighborhoodEstimated Value: $624,000 - $655,000
4
Beds
2
Baths
1,842
Sq Ft
$349/Sq Ft
Est. Value
About This Home
This home is located at 2145 Crown Point Ct, Reno, NV 89523 and is currently estimated at $642,960, approximately $349 per square foot. 2145 Crown Point Ct is a home located in Washoe County with nearby schools including Rollan D. Melton Elementary School, B D Billinghurst Middle School, and Robert McQueen High School.
Ownership History
Date
Name
Owned For
Owner Type
Purchase Details
Closed on
Mar 3, 2003
Sold by
Vandenbos Gregory E and Vandenbos Victoria L
Bought by
Devine Michael A and Devine Marcie J
Current Estimated Value
Home Financials for this Owner
Home Financials are based on the most recent Mortgage that was taken out on this home.
Original Mortgage
$191,200
Outstanding Balance
$81,897
Interest Rate
5.83%
Estimated Equity
$561,063
Purchase Details
Closed on
Dec 19, 2000
Sold by
Mathews Thomas W and Mathews Heather H
Bought by
Vandenbos Gregory E and Vandenbos Victoria L
Home Financials for this Owner
Home Financials are based on the most recent Mortgage that was taken out on this home.
Original Mortgage
$166,500
Interest Rate
7.65%
Purchase Details
Closed on
Mar 14, 1995
Sold by
Bailey and Bailey Mcgah
Bought by
Mathews Thomas W and Mathews Heather H
Home Financials for this Owner
Home Financials are based on the most recent Mortgage that was taken out on this home.
Original Mortgage
$149,550
Interest Rate
9.03%
Create a Home Valuation Report for This Property
The Home Valuation Report is an in-depth analysis detailing your home's value as well as a comparison with similar homes in the area
Home Values in the Area
Average Home Value in this Area
Purchase History
| Date | Buyer | Sale Price | Title Company |
|---|---|---|---|
| Devine Michael A | $239,000 | Stewart Title Of Northern Nv | |
| Vandenbos Gregory E | $185,000 | Western Title Inc | |
| Mathews Thomas W | $166,500 | Stewart Title |
Source: Public Records
Mortgage History
| Date | Status | Borrower | Loan Amount |
|---|---|---|---|
| Open | Devine Michael A | $191,200 | |
| Previous Owner | Vandenbos Gregory E | $166,500 | |
| Previous Owner | Mathews Thomas W | $149,550 | |
| Closed | Devine Michael A | $13,500 |
Source: Public Records
Tax History Compared to Growth
Tax History
| Year | Tax Paid | Tax Assessment Tax Assessment Total Assessment is a certain percentage of the fair market value that is determined by local assessors to be the total taxable value of land and additions on the property. | Land | Improvement |
|---|---|---|---|---|
| 2025 | $2,919 | $119,565 | $43,575 | $75,990 |
| 2024 | $2,835 | $112,730 | $35,735 | $76,995 |
| 2023 | $2,835 | $112,662 | $39,585 | $73,077 |
| 2022 | $2,754 | $94,679 | $33,565 | $61,114 |
| 2021 | $2,674 | $87,777 | $26,775 | $61,002 |
| 2020 | $2,593 | $88,141 | $26,810 | $61,331 |
| 2019 | $2,518 | $87,080 | $26,810 | $60,270 |
| 2018 | $2,317 | $75,167 | $19,775 | $55,392 |
| 2017 | $2,249 | $74,133 | $18,515 | $55,618 |
| 2016 | $2,192 | $74,669 | $17,605 | $57,064 |
| 2015 | $1,644 | $71,972 | $15,015 | $56,957 |
| 2014 | $2,126 | $68,095 | $12,950 | $55,145 |
| 2013 | -- | $58,338 | $9,695 | $48,643 |
Source: Public Records
Map
Nearby Homes
- 6368 Springwood Dr
- 6460 Valley Wood Dr
- 2365 Red Maple Ct
- 1836 Cambridge Hills Ct
- 1751 Glen Oaks Dr
- 2580 Snow Partridge Dr
- 2605 Snow Partridge Dr
- 6220 Valley Wood Dr
- 1931 E Minaret Cir
- 2163 3 Wood Ln
- 2273 Sapphire Ridge Way
- 1651 Ashbury Ln
- 5921 Sapphire Ridge Ct
- 1664 Shadow Wood Rd
- 2014 Cradle Mountain Dr Unit 2
- 2730 Avenida de Landa
- 6811 Sonterra Ln
- 1770 Amarak Way
- 5765 Tappan Dr
- 5940 Platinum Ridge Ct
- 2135 Crown Point Ct
- 2155 Crown Point Ct
- 6580 Westchester Ct
- 2240 Gatewood Dr
- 2230 Gatewood Dr
- 2250 Gatewood Dr
- 2220 Gatewood Dr
- 2150 Crown Point Ct
- 6570 Westchester Ct
- 2125 Crown Point Ct
- 6523 Springwood Dr
- 2140 Crown Point Ct
- 2130 Crown Point Ct
- 6560 Westchester Ct
- 6531 Springwood Dr
- 2120 Crown Point Ct
- 2235 Gatewood Dr
- 6585 Westchester Ct
- 6595 Westchester Ct
- 6550 Westchester Ct