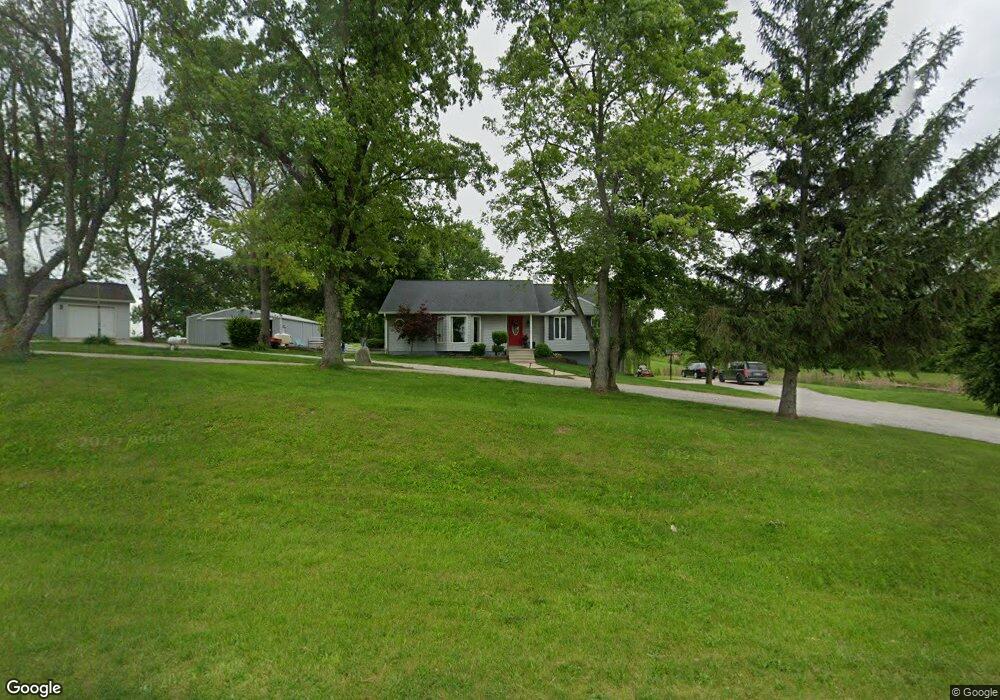
2145 E Elwin Rd Decatur, IL 62521
Estimated Value: $243,000 - $430,000
3
Beds
3
Baths
3,125
Sq Ft
$110/Sq Ft
Est. Value
About This Home
This home is located at 2145 E Elwin Rd, Decatur, IL 62521 and is currently estimated at $342,498, approximately $109 per square foot. 2145 E Elwin Rd is a home located in Macon County with nearby schools including McGaughey Elementary School, Mt. Zion Elementary School, and Mt. Zion Intermediate School.
Ownership History
Date
Name
Owned For
Owner Type
Purchase Details
Closed on
Dec 28, 2006
Sold by
Butler Daniel E
Bought by
Maclntosh John R and Maclntosh Lisa J
Current Estimated Value
Home Financials for this Owner
Home Financials are based on the most recent Mortgage that was taken out on this home.
Original Mortgage
$162,552
Outstanding Balance
$97,303
Interest Rate
6.24%
Mortgage Type
FHA
Estimated Equity
$245,195
Purchase Details
Closed on
Apr 12, 2006
Sold by
Household Finance Corp Iii
Bought by
Butler Daniel E
Home Financials for this Owner
Home Financials are based on the most recent Mortgage that was taken out on this home.
Original Mortgage
$122,400
Interest Rate
7%
Mortgage Type
Adjustable Rate Mortgage/ARM
Purchase Details
Closed on
Nov 16, 2005
Sold by
Smith Warren S
Bought by
Household Finance Corp Iii
Purchase Details
Closed on
Nov 1, 2002
Create a Home Valuation Report for This Property
The Home Valuation Report is an in-depth analysis detailing your home's value as well as a comparison with similar homes in the area
Purchase History
| Date | Buyer | Sale Price | Title Company |
|---|---|---|---|
| Maclntosh John R | $170,000 | None Available | |
| Butler Daniel E | $136,000 | None Available | |
| Household Finance Corp Iii | -- | None Available | |
| -- | $157,500 | -- |
Source: Public Records
Mortgage History
| Date | Status | Borrower | Loan Amount |
|---|---|---|---|
| Open | Maclntosh John R | $162,552 | |
| Previous Owner | Butler Daniel E | $122,400 |
Source: Public Records
Tax History
| Year | Tax Paid | Tax Assessment Tax Assessment Total Assessment is a certain percentage of the fair market value that is determined by local assessors to be the total taxable value of land and additions on the property. | Land | Improvement |
|---|---|---|---|---|
| 2024 | $5,223 | $84,575 | $10,082 | $74,493 |
| 2023 | $5,047 | $78,660 | $9,377 | $69,283 |
| 2022 | $4,824 | $74,609 | $8,894 | $65,715 |
| 2021 | $4,653 | $69,897 | $8,333 | $61,564 |
| 2020 | $4,318 | $66,168 | $7,361 | $58,807 |
| 2019 | $4,318 | $66,168 | $7,361 | $58,807 |
| 2018 | $4,201 | $64,479 | $7,173 | $57,306 |
| 2017 | $4,122 | $63,239 | $7,035 | $56,204 |
| 2016 | $4,066 | $62,139 | $6,913 | $55,226 |
| 2015 | $3,943 | $61,524 | $6,845 | $54,679 |
| 2014 | $3,831 | $61,524 | $6,845 | $54,679 |
| 2013 | $3,896 | $61,524 | $6,845 | $54,679 |
Source: Public Records
Map
Nearby Homes
- 2295 Deer Run Ct
- 3258 Kathy Ct
- 2215 Deer Run Ct
- 2201 Deer Run Ct
- 3248 Kathy Ct
- 1935 Buckhead Ct
- 2202 Deer Run Ct
- 2298 Deer Run Ct
- 3202 Kathy Ct
- 1820 Buckhead Ln
- 3198 Kathy Ct
- 2035 Buckhead Blvd
- 2625 Lake Reunion Pkwy
- 2020 Buckhead Ln
- 2030 Buckhead Ln
- 2635 Lake Reunion Pkwy
- 2620 Lake Reunion Pkwy
- 2110 Buckhead Ln
- 2625 Craycroft Pkwy
- 2630 Lake Reunion Pkwy
- 2113 E Elwin Rd
- 2103 E Elwin Rd
- 5278 Walmsley Rd
- 5082 Walmsley Rd
- 5216 Walmsley Rd
- 5256 Walmsley Rd
- 5213 Walmsley Rd
- 5282 Walmsley Rd
- 5308 Walmsley Rd
- 5314 Walmsley Rd
- 5295 Walmsley Rd
- 1853 E Elwin Rd
- 5330 Walmsley Rd
- 5354 Walmsley Rd
- 4947 Walmsley Rd
- 5329 Walmsley Rd
- 1780 E Elwin Rd
- 5337 Walmsley Rd
- 4807 Walmsley Rd
- 5347 Walmsley Rd
Your Personal Tour Guide
Ask me questions while you tour the home.