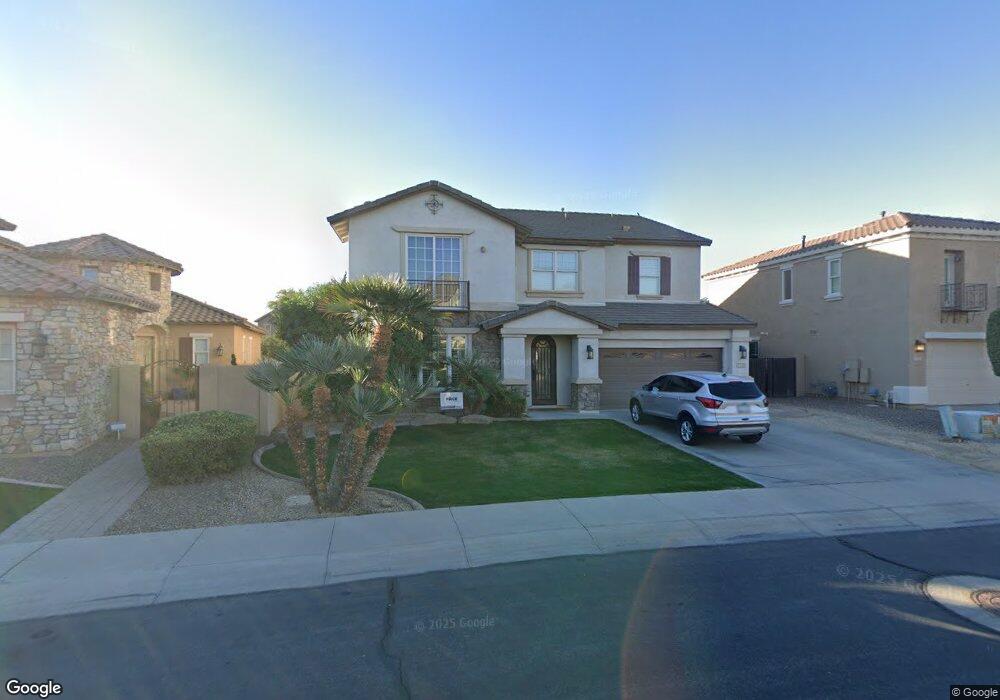
2145 E Honeysuckle Place Chandler, AZ 85286
South Chandler NeighborhoodEstimated Value: $731,236 - $882,000
Studio
3
Baths
3,676
Sq Ft
$219/Sq Ft
Est. Value
About This Home
This home is located at 2145 E Honeysuckle Place, Chandler, AZ 85286 and is currently estimated at $806,559, approximately $219 per square foot. 2145 E Honeysuckle Place is a home located in Maricopa County with nearby schools including Audrey & Robert Ryan Elementary School, Santan Junior High School, and Legacy Online Academy.
Ownership History
Date
Name
Owned For
Owner Type
Purchase Details
Closed on
Mar 23, 2007
Sold by
Hilton Megan
Bought by
Pace Ari
Current Estimated Value
Home Financials for this Owner
Home Financials are based on the most recent Mortgage that was taken out on this home.
Original Mortgage
$500,000
Outstanding Balance
$227,763
Interest Rate
2.25%
Mortgage Type
Negative Amortization
Estimated Equity
$578,796
Purchase Details
Closed on
Mar 19, 2007
Sold by
Silver Kimberly L
Bought by
Pace Ari
Home Financials for this Owner
Home Financials are based on the most recent Mortgage that was taken out on this home.
Original Mortgage
$500,000
Outstanding Balance
$227,763
Interest Rate
2.25%
Mortgage Type
Negative Amortization
Estimated Equity
$578,796
Purchase Details
Closed on
Jan 10, 2006
Sold by
Silver Cortland John
Bought by
Silver Kimberly L
Create a Home Valuation Report for This Property
The Home Valuation Report is an in-depth analysis detailing your home's value as well as a comparison with similar homes in the area
Home Values in the Area
Average Home Value in this Area
Purchase History
| Date | Buyer | Sale Price | Title Company |
|---|---|---|---|
| Pace Ari | -- | Security Title Agency Inc | |
| Pace Ari | $591,286 | Security Title Agency Inc | |
| Silver Kimberly L | -- | Chicago Title Insurance Co | |
| Silver Kimberly L | $536,558 | Chicago Title Insurance Co |
Source: Public Records
Mortgage History
| Date | Status | Borrower | Loan Amount |
|---|---|---|---|
| Open | Pace Ari | $500,000 | |
| Closed | Pace Ari | $500,000 |
Source: Public Records
Tax History
| Year | Tax Paid | Tax Assessment Tax Assessment Total Assessment is a certain percentage of the fair market value that is determined by local assessors to be the total taxable value of land and additions on the property. | Land | Improvement |
|---|---|---|---|---|
| 2025 | $3,587 | $44,419 | -- | -- |
| 2024 | $3,443 | $42,304 | -- | -- |
| 2023 | $3,443 | $58,260 | $11,650 | $46,610 |
| 2022 | $3,316 | $43,350 | $8,670 | $34,680 |
| 2021 | $3,419 | $40,610 | $8,120 | $32,490 |
| 2020 | $3,395 | $38,860 | $7,770 | $31,090 |
| 2019 | $3,263 | $36,210 | $7,240 | $28,970 |
| 2018 | $3,158 | $34,660 | $6,930 | $27,730 |
| 2017 | $2,945 | $33,030 | $6,600 | $26,430 |
| 2016 | $2,838 | $33,460 | $6,690 | $26,770 |
| 2015 | $2,747 | $31,880 | $6,370 | $25,510 |
Source: Public Records
Map
Nearby Homes
- 2264 E Desert Broom Place
- 2198 E Wisteria Dr
- 2029 E Hackberry Place
- 2041 E Wisteria Dr
- 2060 E Wisteria Dr
- 3095 S Ashley Dr
- 2288 E Wisteria Dr
- 3067 S Halsted Dr
- 1871 E Lantana Dr
- 2469 E Lantana Dr
- 2361 E Azalea Dr
- 2092 E Jade Dr
- 1870 E Indigo Dr
- 2576 E Dogwood Dr
- 3151 S Eagle Dr
- 3605 S Danielson Way
- 1816 E Carob Dr
- 3640 S Tower Ave
- 2438 E Iris Dr
- 2489 E Sequoia Dr
- 2135 E Honeysuckle Place
- 2155 E Honeysuckle Place
- 2125 E Honeysuckle Place
- 2165 E Honeysuckle Place
- 3234 S Salt Cedar Ct
- 2115 E Honeysuckle Place
- 2126 E Desert Broom Dr
- 2124 E Honeysuckle Place
- 3130 S Salt Cedar Place
- 2136 E Desert Broom Dr
- 2105 E Honeysuckle Place
- 2114 E Honeysuckle Place
- 2146 E Desert Broom Dr
- 3131 S Valerie Dr
- 3120 S Salt Cedar Place
- 2104 E Honeysuckle Place
- 3225 S Salt Cedar Ct
- 2095 E Honeysuckle Place
- 3121 S Valerie Dr
- 3110 S Salt Cedar Place
Your Personal Tour Guide
Ask me questions while you tour the home.