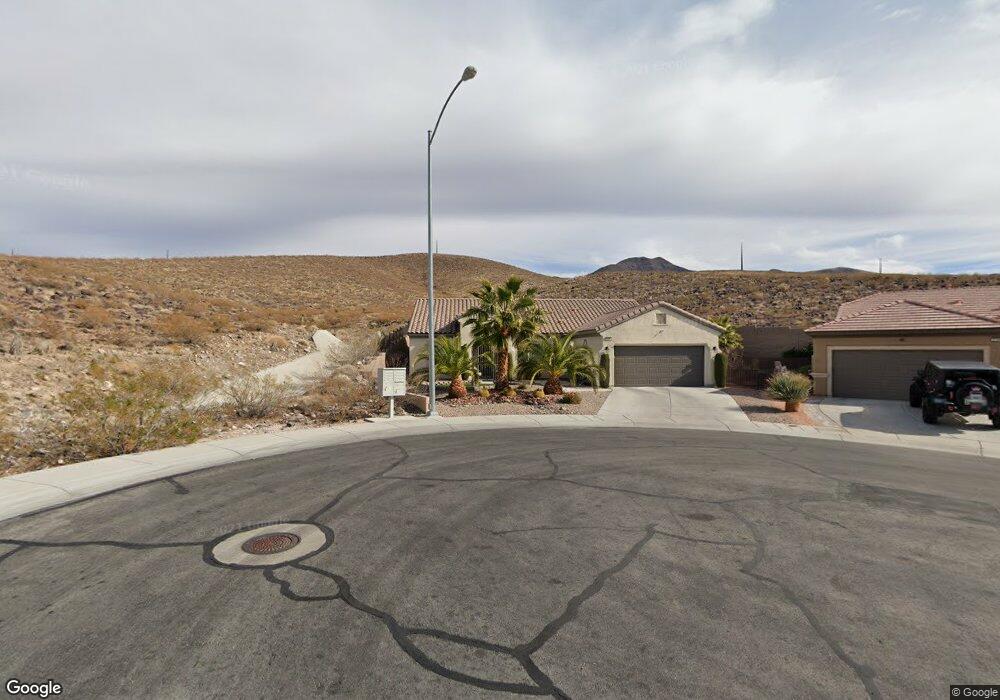
2145 Falls City Ct Henderson, NV 89044
Sun City Anthem NeighborhoodEstimated Value: $643,466 - $749,000
2
Beds
2
Baths
2,401
Sq Ft
$286/Sq Ft
Est. Value
About This Home
This home is located at 2145 Falls City Ct, Henderson, NV 89044 and is currently estimated at $686,617, approximately $285 per square foot. 2145 Falls City Ct is a home located in Clark County with nearby schools including Shirley & Bill Wallin Elementary School, Del E. Webb Middle School, and Liberty High School.
Ownership History
Date
Name
Owned For
Owner Type
Purchase Details
Closed on
Feb 4, 2009
Sold by
Williams Charles L
Bought by
Williams Charles L and Williams Cynthia G
Current Estimated Value
Purchase Details
Closed on
Dec 2, 2005
Sold by
Williams Cynthia
Bought by
Williams Charles L
Home Financials for this Owner
Home Financials are based on the most recent Mortgage that was taken out on this home.
Original Mortgage
$348,651
Interest Rate
6.14%
Mortgage Type
Balloon
Create a Home Valuation Report for This Property
The Home Valuation Report is an in-depth analysis detailing your home's value as well as a comparison with similar homes in the area
Home Values in the Area
Average Home Value in this Area
Purchase History
| Date | Buyer | Sale Price | Title Company |
|---|---|---|---|
| Williams Charles L | -- | None Available | |
| Williams Charles L | -- | Lawyers Title Of Nevada | |
| Williams Charles L | $435,814 | Lawyers Title Of Nevada |
Source: Public Records
Mortgage History
| Date | Status | Borrower | Loan Amount |
|---|---|---|---|
| Closed | Williams Charles L | $348,651 |
Source: Public Records
Tax History Compared to Growth
Tax History
| Year | Tax Paid | Tax Assessment Tax Assessment Total Assessment is a certain percentage of the fair market value that is determined by local assessors to be the total taxable value of land and additions on the property. | Land | Improvement |
|---|---|---|---|---|
| 2025 | $3,347 | $157,404 | $50,750 | $106,654 |
| 2024 | $3,371 | $157,404 | $50,750 | $106,654 |
| 2023 | $3,371 | $148,255 | $47,250 | $101,005 |
| 2022 | $3,273 | $131,028 | $39,200 | $91,828 |
| 2021 | $3,178 | $121,100 | $33,950 | $87,150 |
| 2020 | $3,082 | $119,803 | $33,600 | $86,203 |
| 2019 | $2,992 | $116,282 | $31,500 | $84,782 |
| 2018 | $2,905 | $111,094 | $29,750 | $81,344 |
| 2017 | $3,197 | $109,350 | $28,000 | $81,350 |
| 2016 | $2,751 | $105,791 | $22,750 | $83,041 |
| 2015 | $2,744 | $97,386 | $15,750 | $81,636 |
| 2014 | $2,664 | $91,224 | $12,250 | $78,974 |
Source: Public Records
Map
Nearby Homes
- 2163 Bannerwood St Unit 30
- 2151 Bannerwood St
- 2188 Bannerwood St
- 2159 Bensley St
- 2198 Bensley St
- 2150 Kelsey Creek Ct
- 2148 Shadow Canyon Dr
- 2151 Shadow Canyon Dr
- 2225 Blackburn Hills Ave
- 2148 Silent Echoes Dr
- 2117 Bliss Corner St
- 17 Caprington Rd
- 17 Morninglow Pass
- 1 Awbrey Ct
- 2218 Sandstone Cliffs Dr
- 2 Awbrey Ct
- 4 Awbrey Ct
- 2175 Sandstone Cliffs Dr
- 2142 Sandstone Cliffs Dr
- 2119 Burtonsville Dr Unit 27
- 2149 Falls City Ct
- 2148 Falls City Ct
- 2152 Falls City Ct
- 2156 Falls City Ct
- 2148 Bannerwood St
- 2157 Falls City Ct
- 2152 Long Creek Ct
- 2160 Falls City Ct
- 2152 Bannerwood St
- 2161 Falls City Ct
- 2156 Long Creek Ct
- 2144 Bannerwood St
- 2160 Long Creek Ct
- 2155 Long Creek Ct Unit 30
- 2147 Crescent Heights Ave
- 2151 Crescent Heights Ave
- 2159 Bannerwood St
- 2155 Bannerwood St
- 2140 Bannerwood St
- 2184 Bannerwood St